AUSTRALIAN FIRE HOTSPOT SEASONALITY ANALYSIS
Page prepared by: Adjunct Professor Rick McRae, UNSW Canberra.

A lot is written and discussed about when fires occur across Australia. The fire sector routinely conducts seasonal forecasts and uses these to keep the public aware of coming risk levels.
There are extensive datasets available documenting past fires and past fire weather conditions, both of which are essential for forward outlooks.
One of the key tools is the satellite-derived fire hotspot. For these suitable satellite imagery is run through an algorithm that assesses the likelihood that the infrared signature for any image point (pixel) could be due to fire (as opposed to industrial emissions or sun-heated rocks).
Since 2002 data from MODIS instruments have been the backbone of hotspot generation. These sensors were installed in both the Terra and Aqua satellites, launched by NASA.
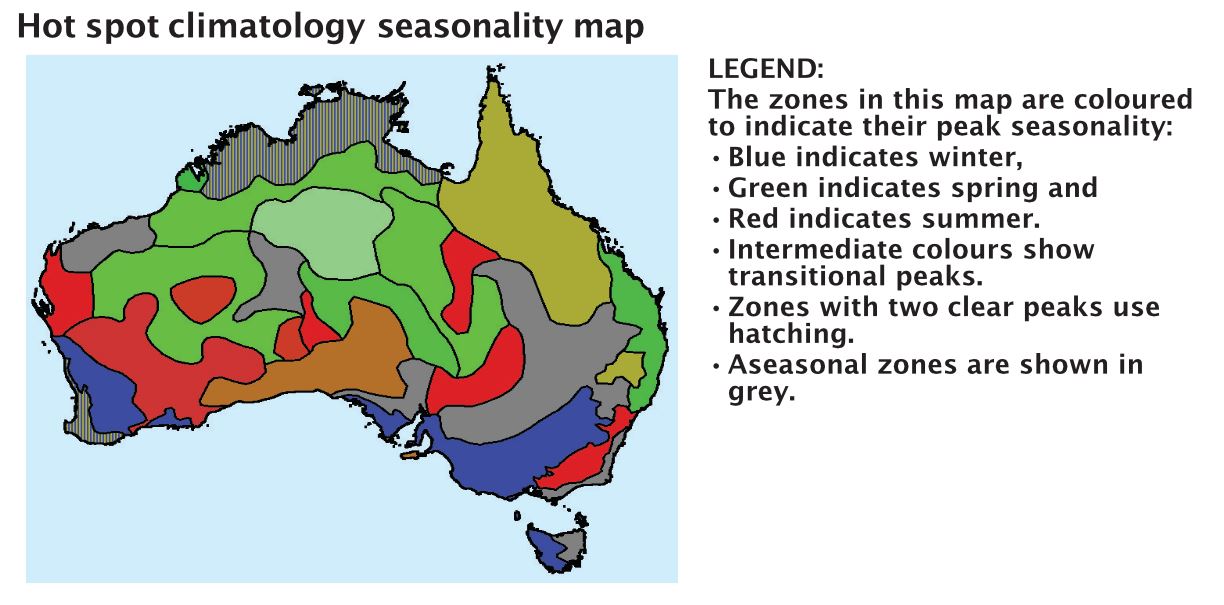
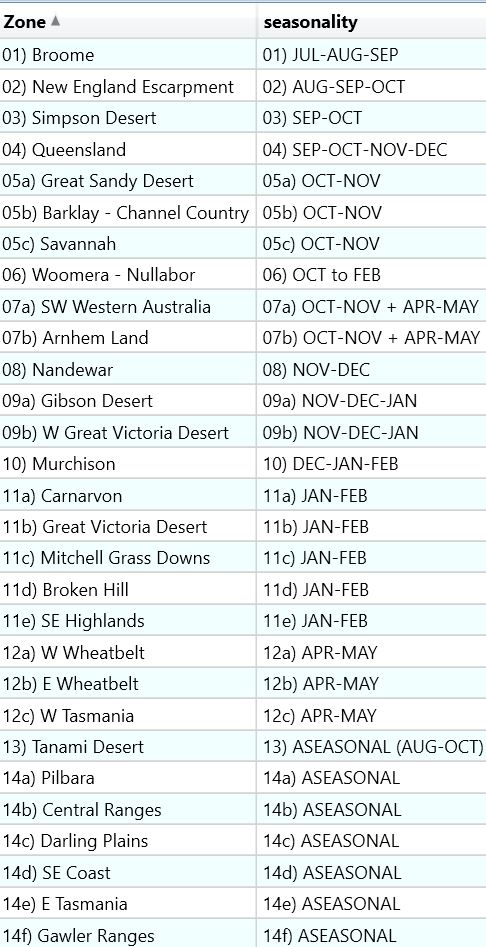
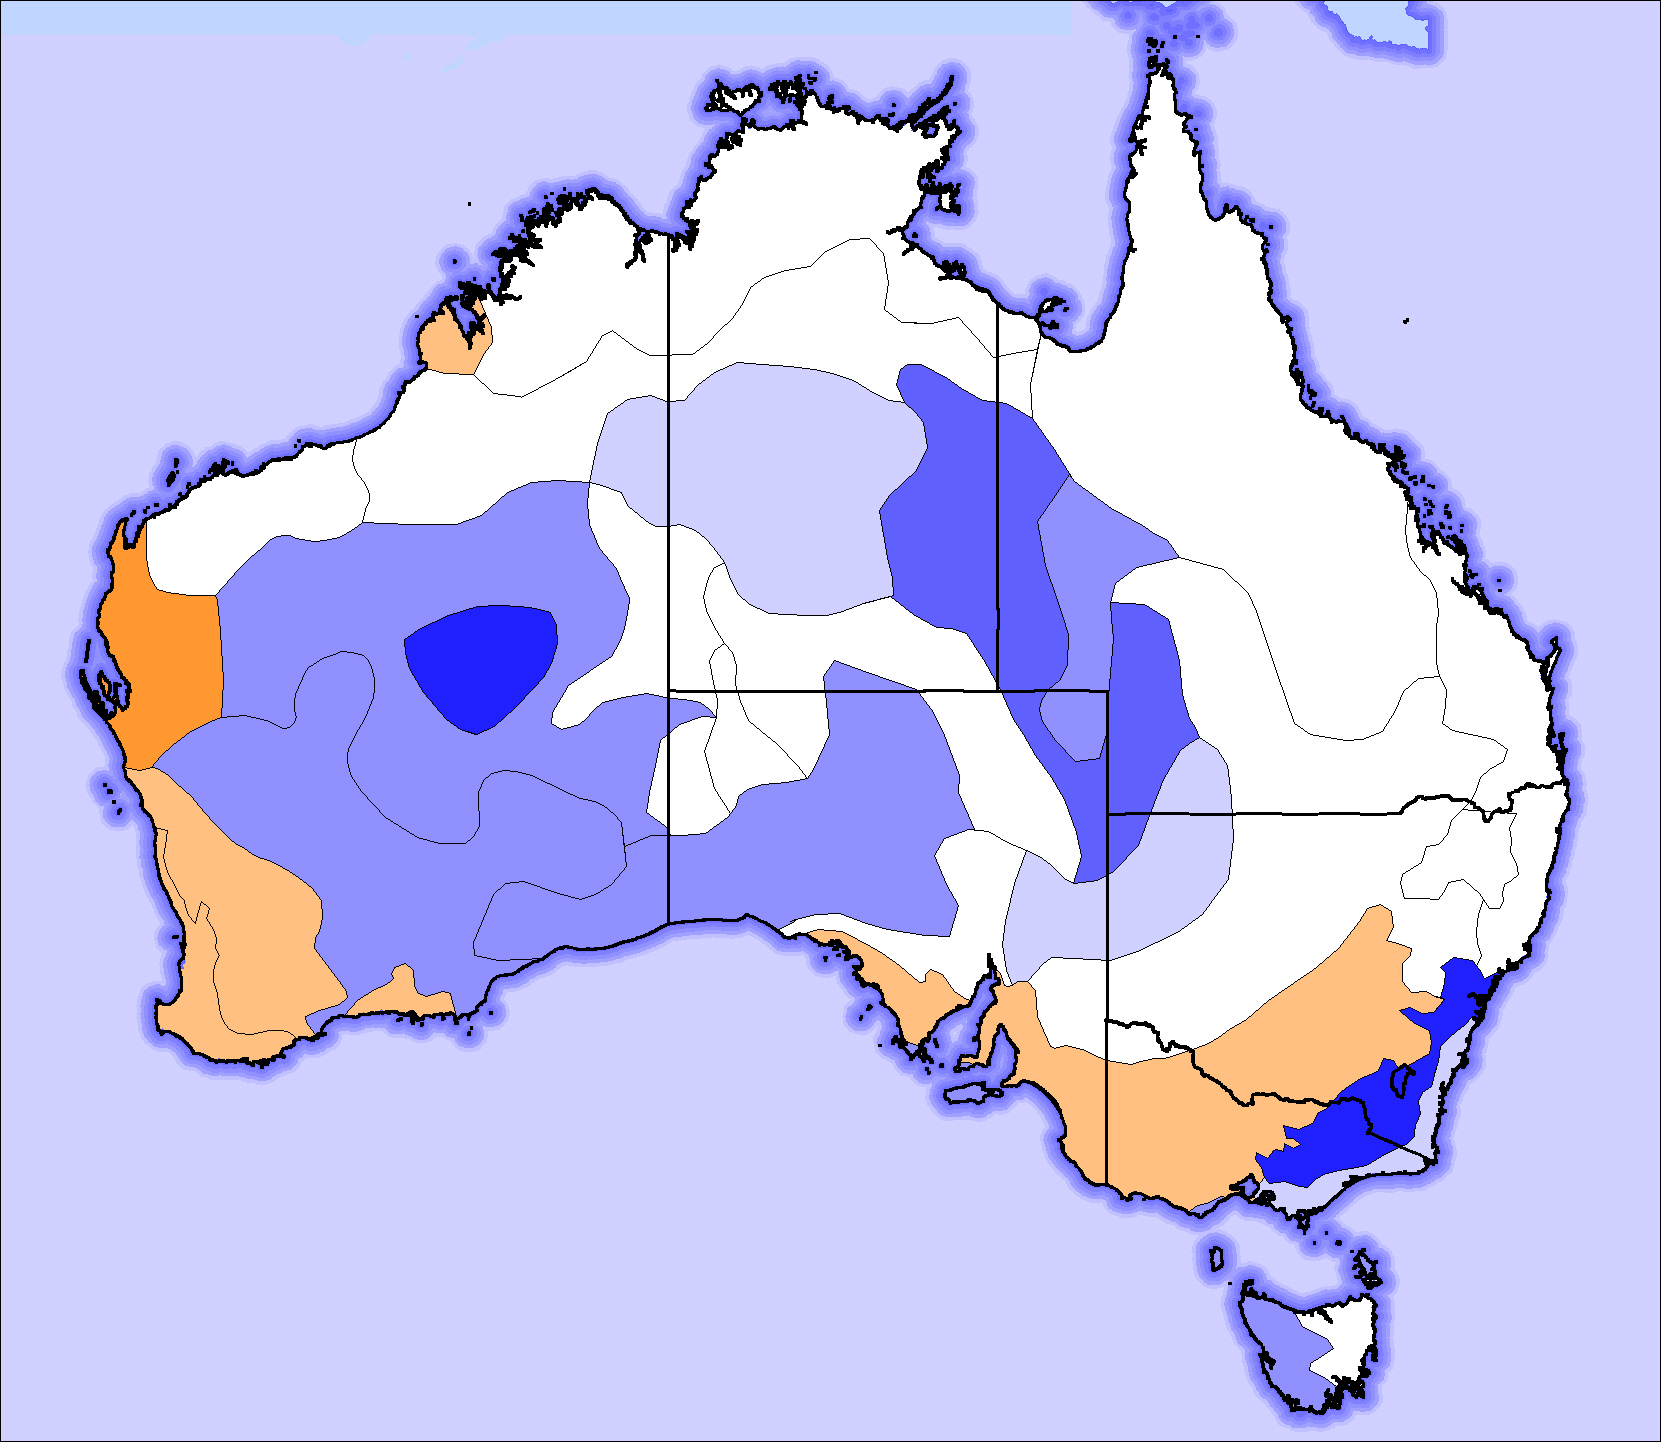
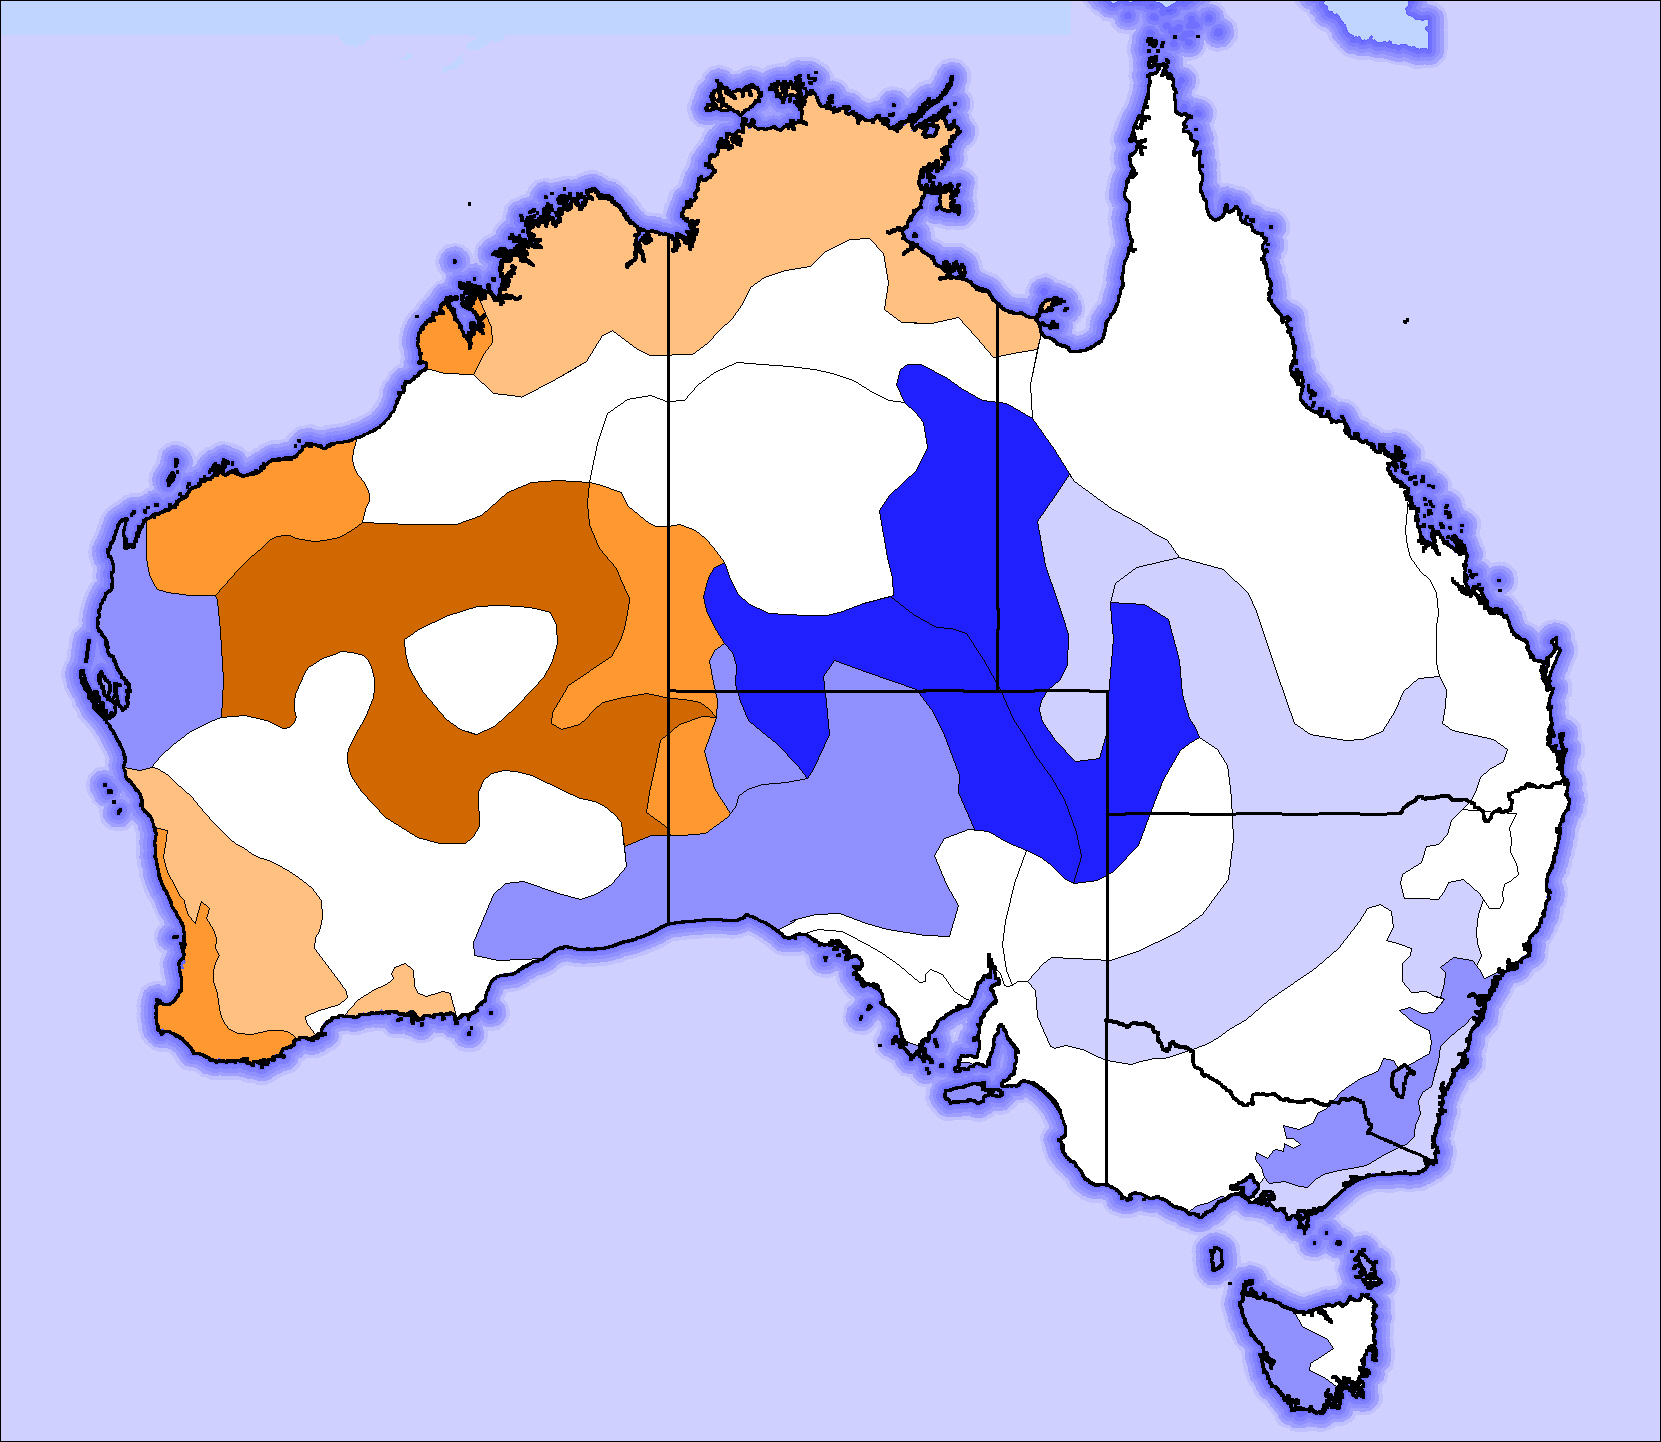
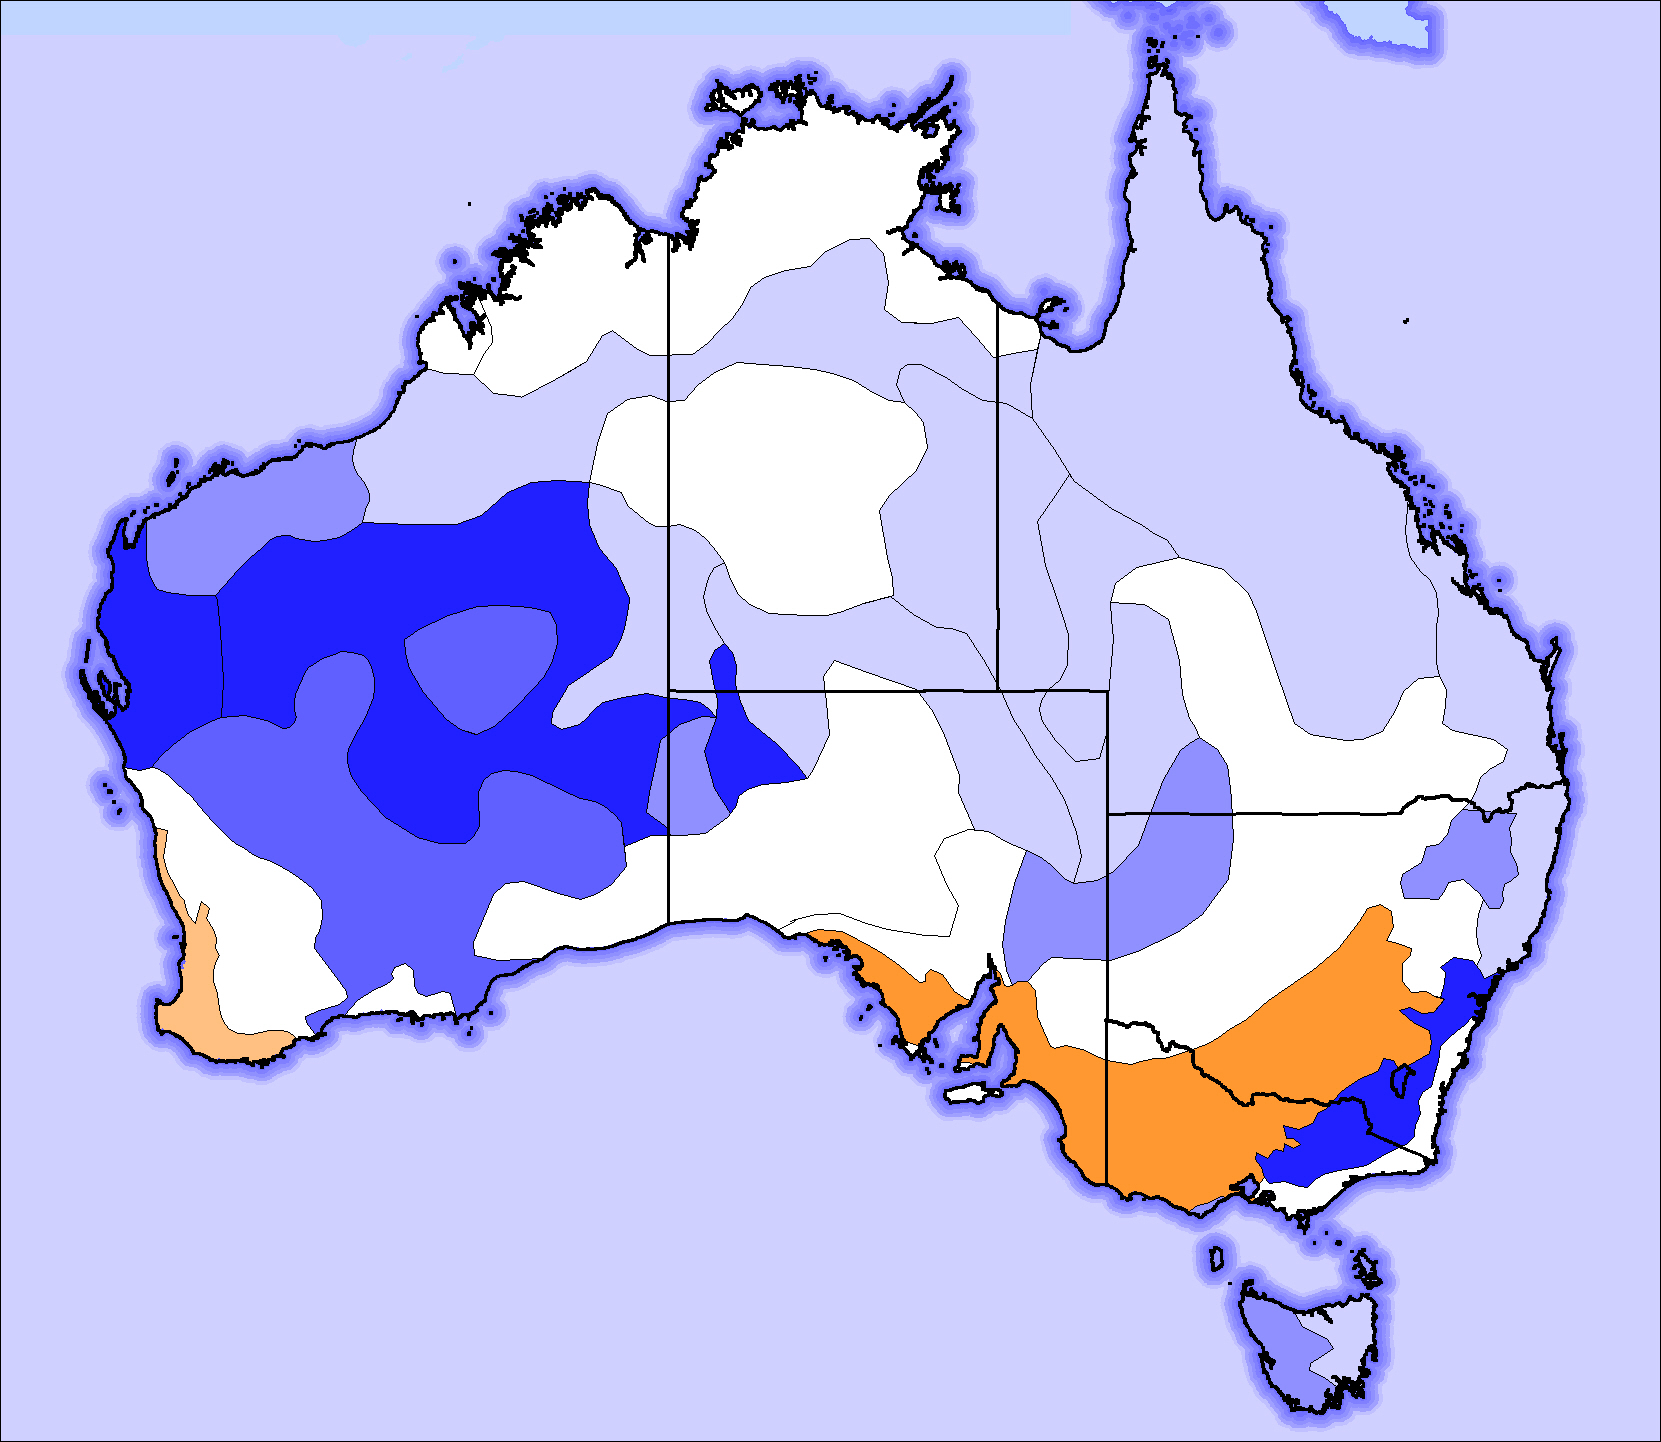
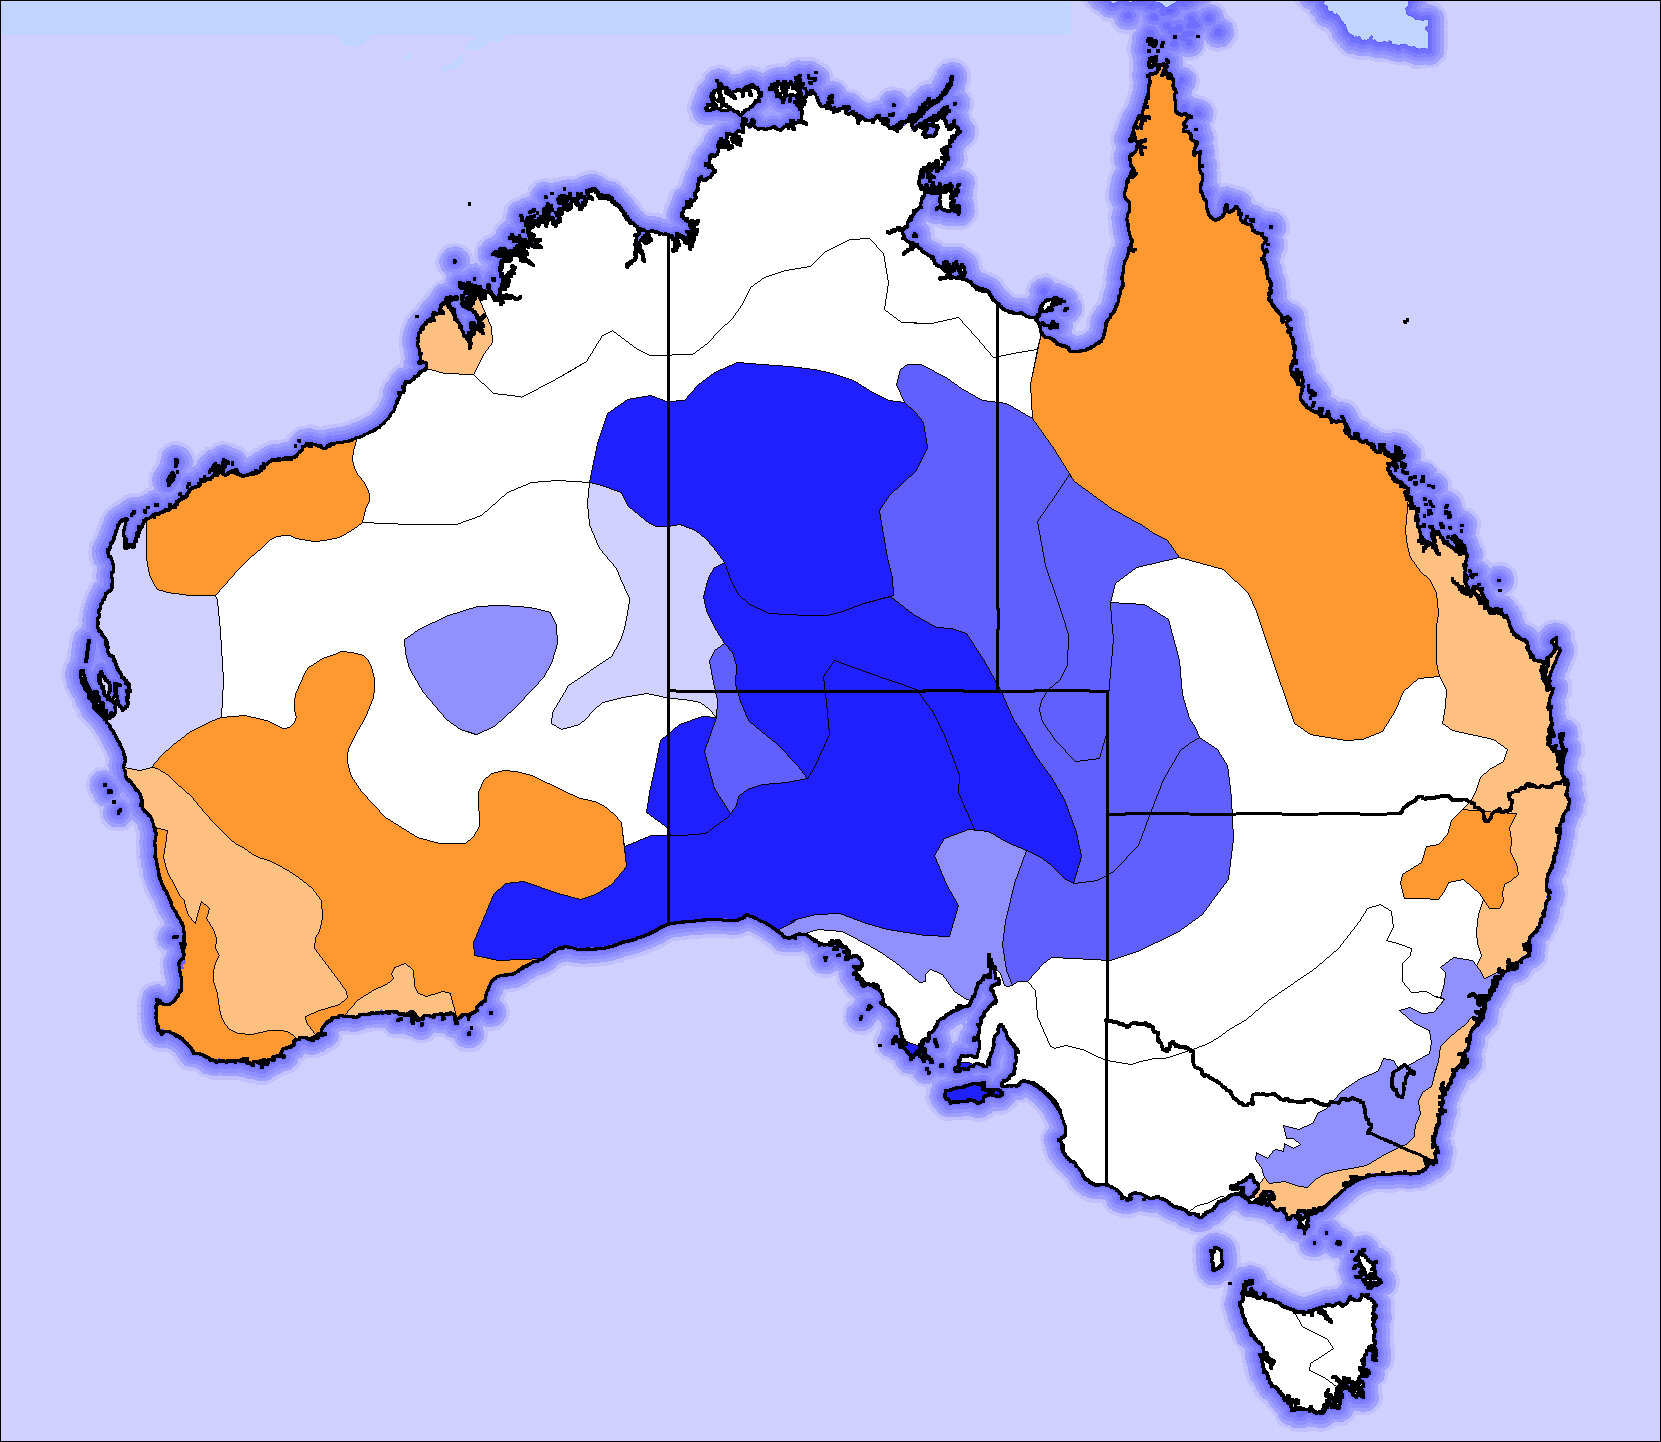
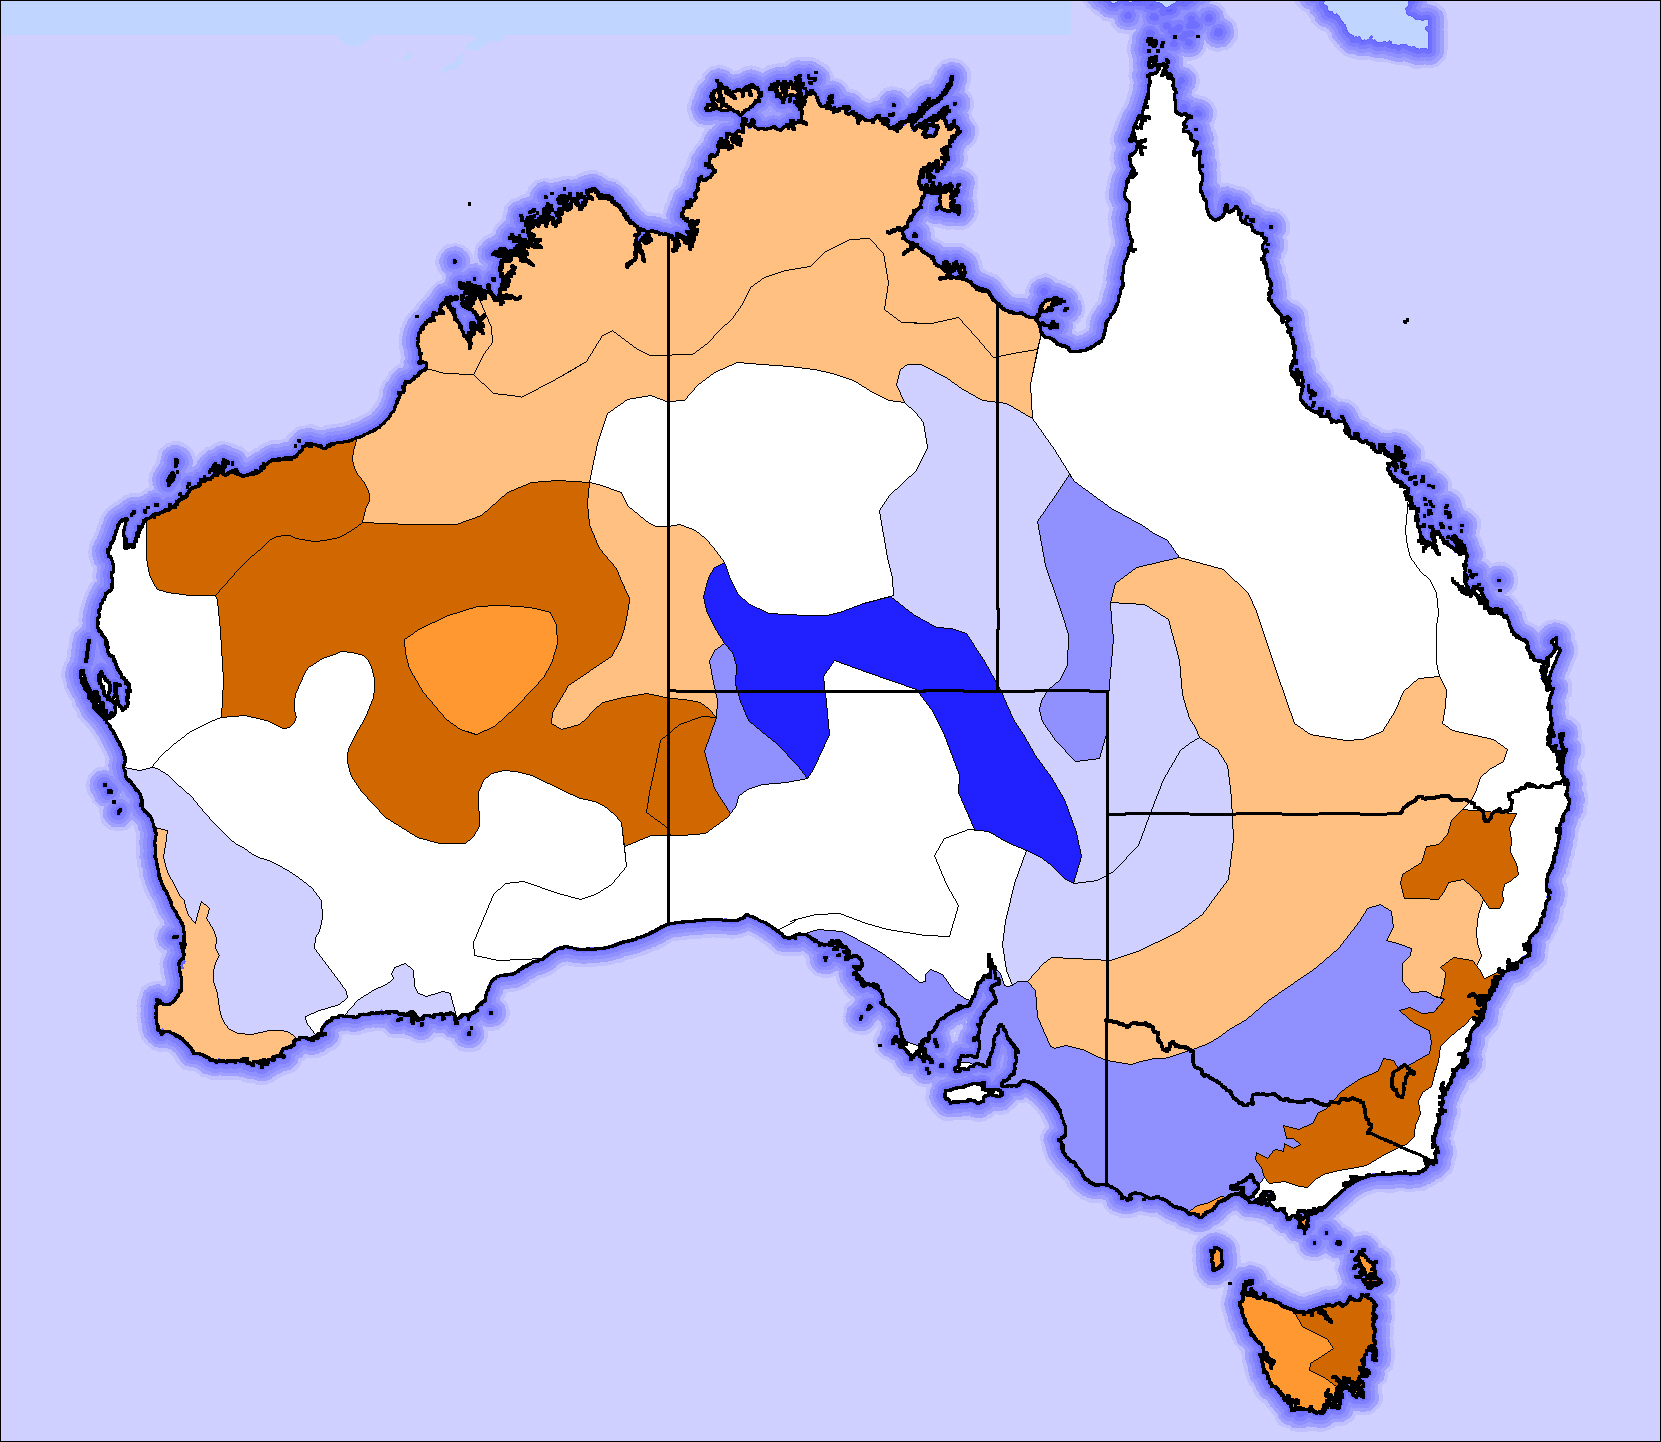
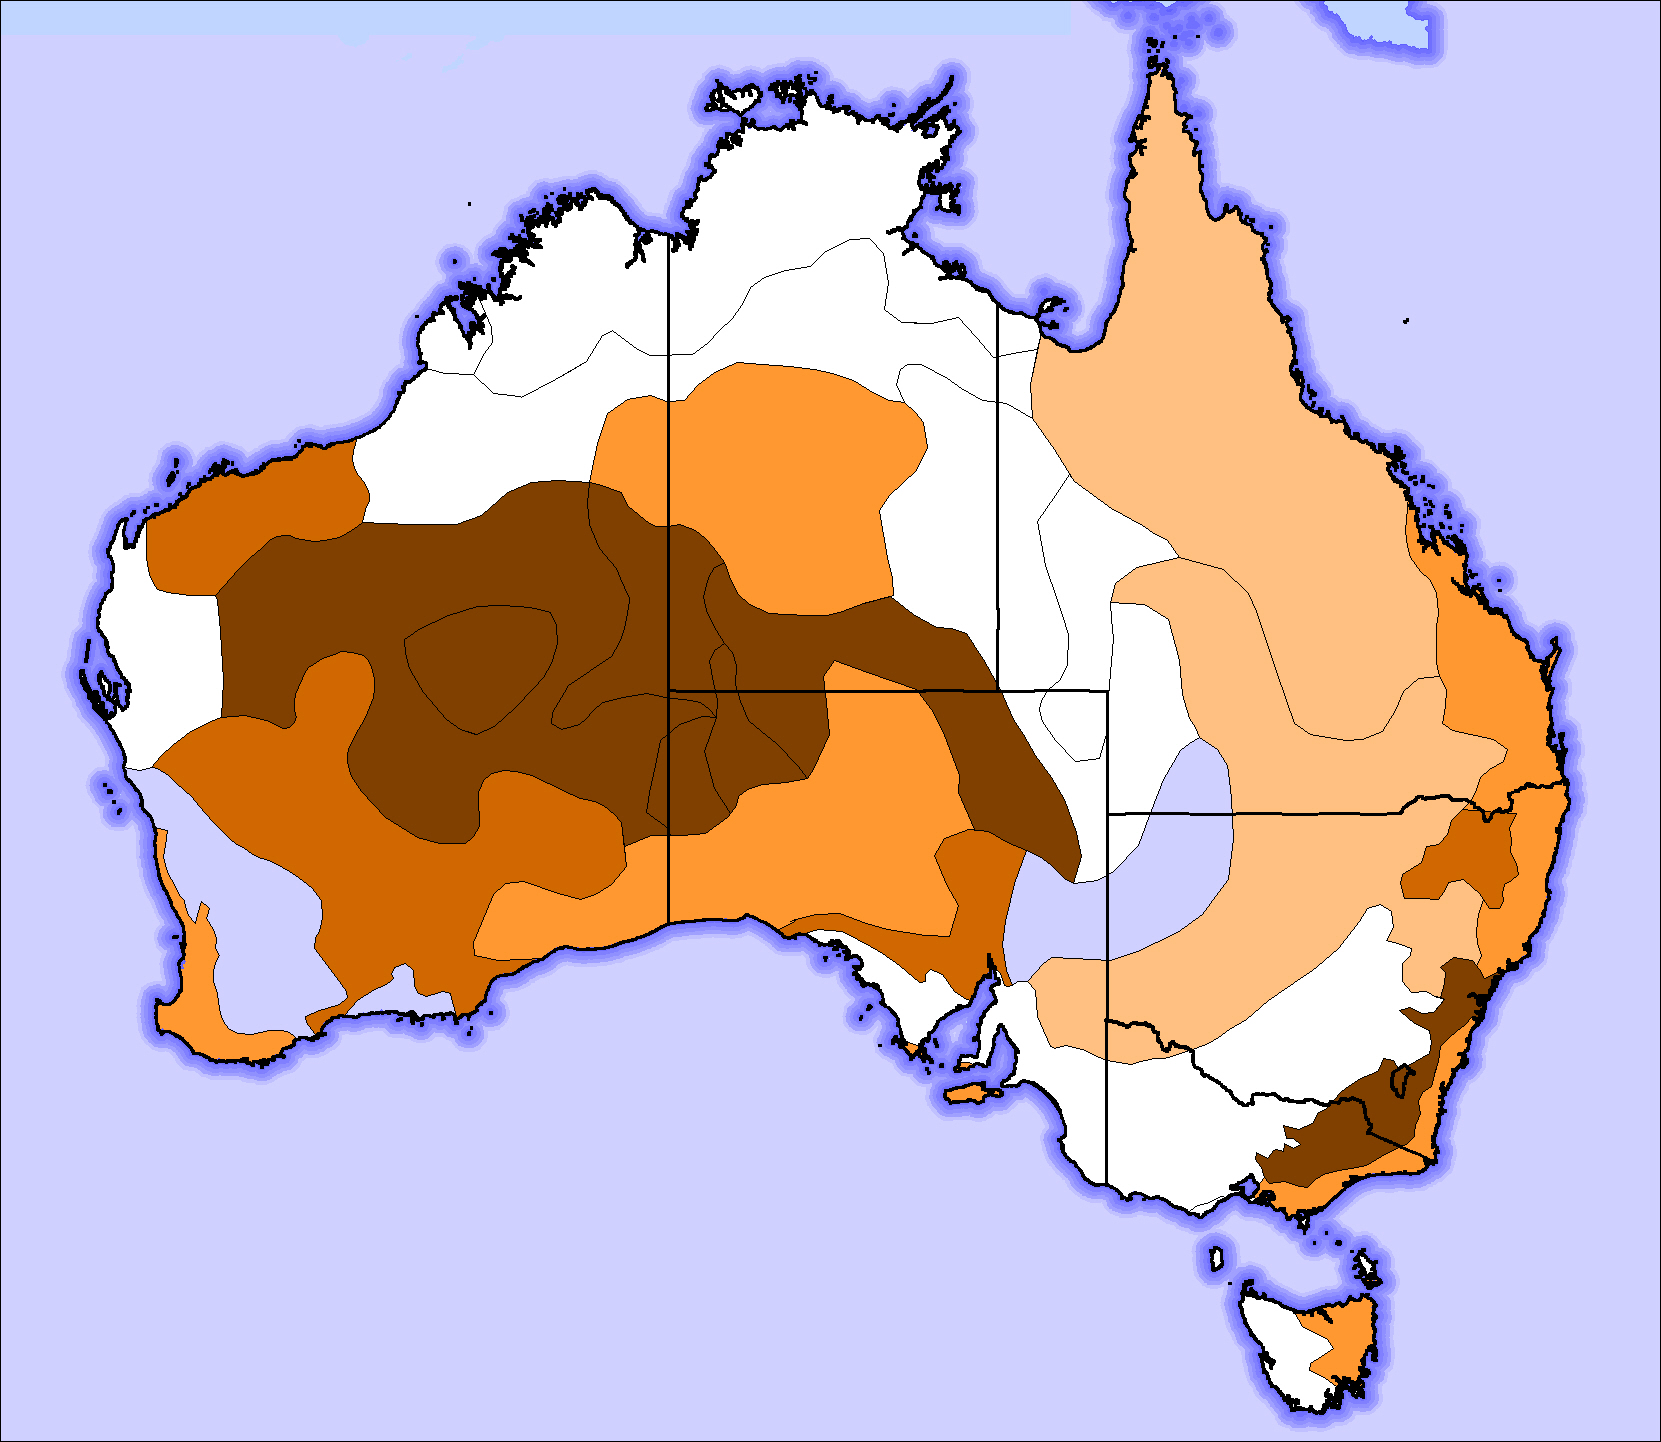
The key idea behind the work presented here is that Australia can be divided into a series of zones that have internally consistent seasonality patterns of fire hotspot occurence. Hotspot seasonality is not linked to the number of hotspot, rather the pattern of relative occurence between months.
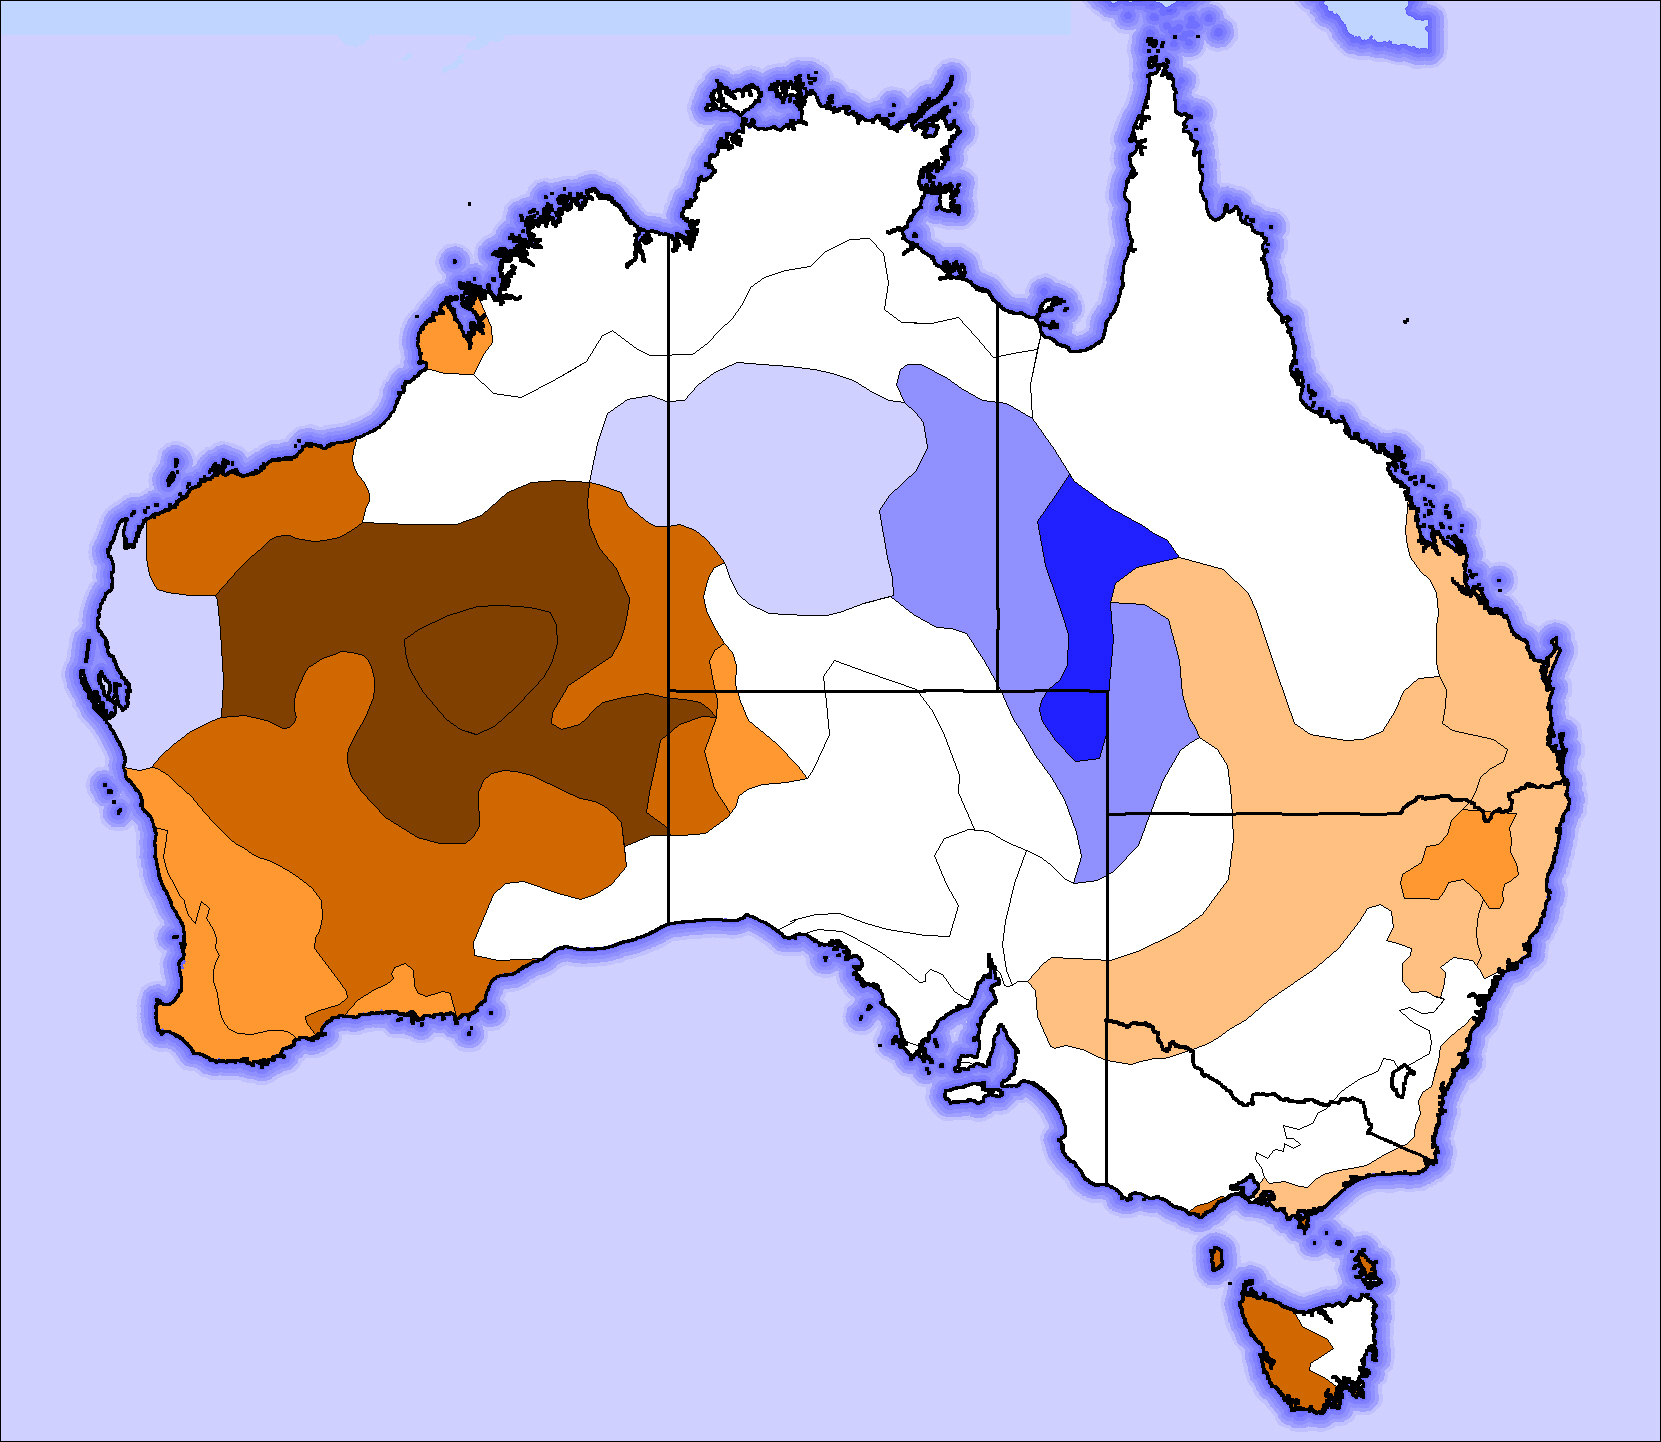
Here is a map of the seasonality pattern:
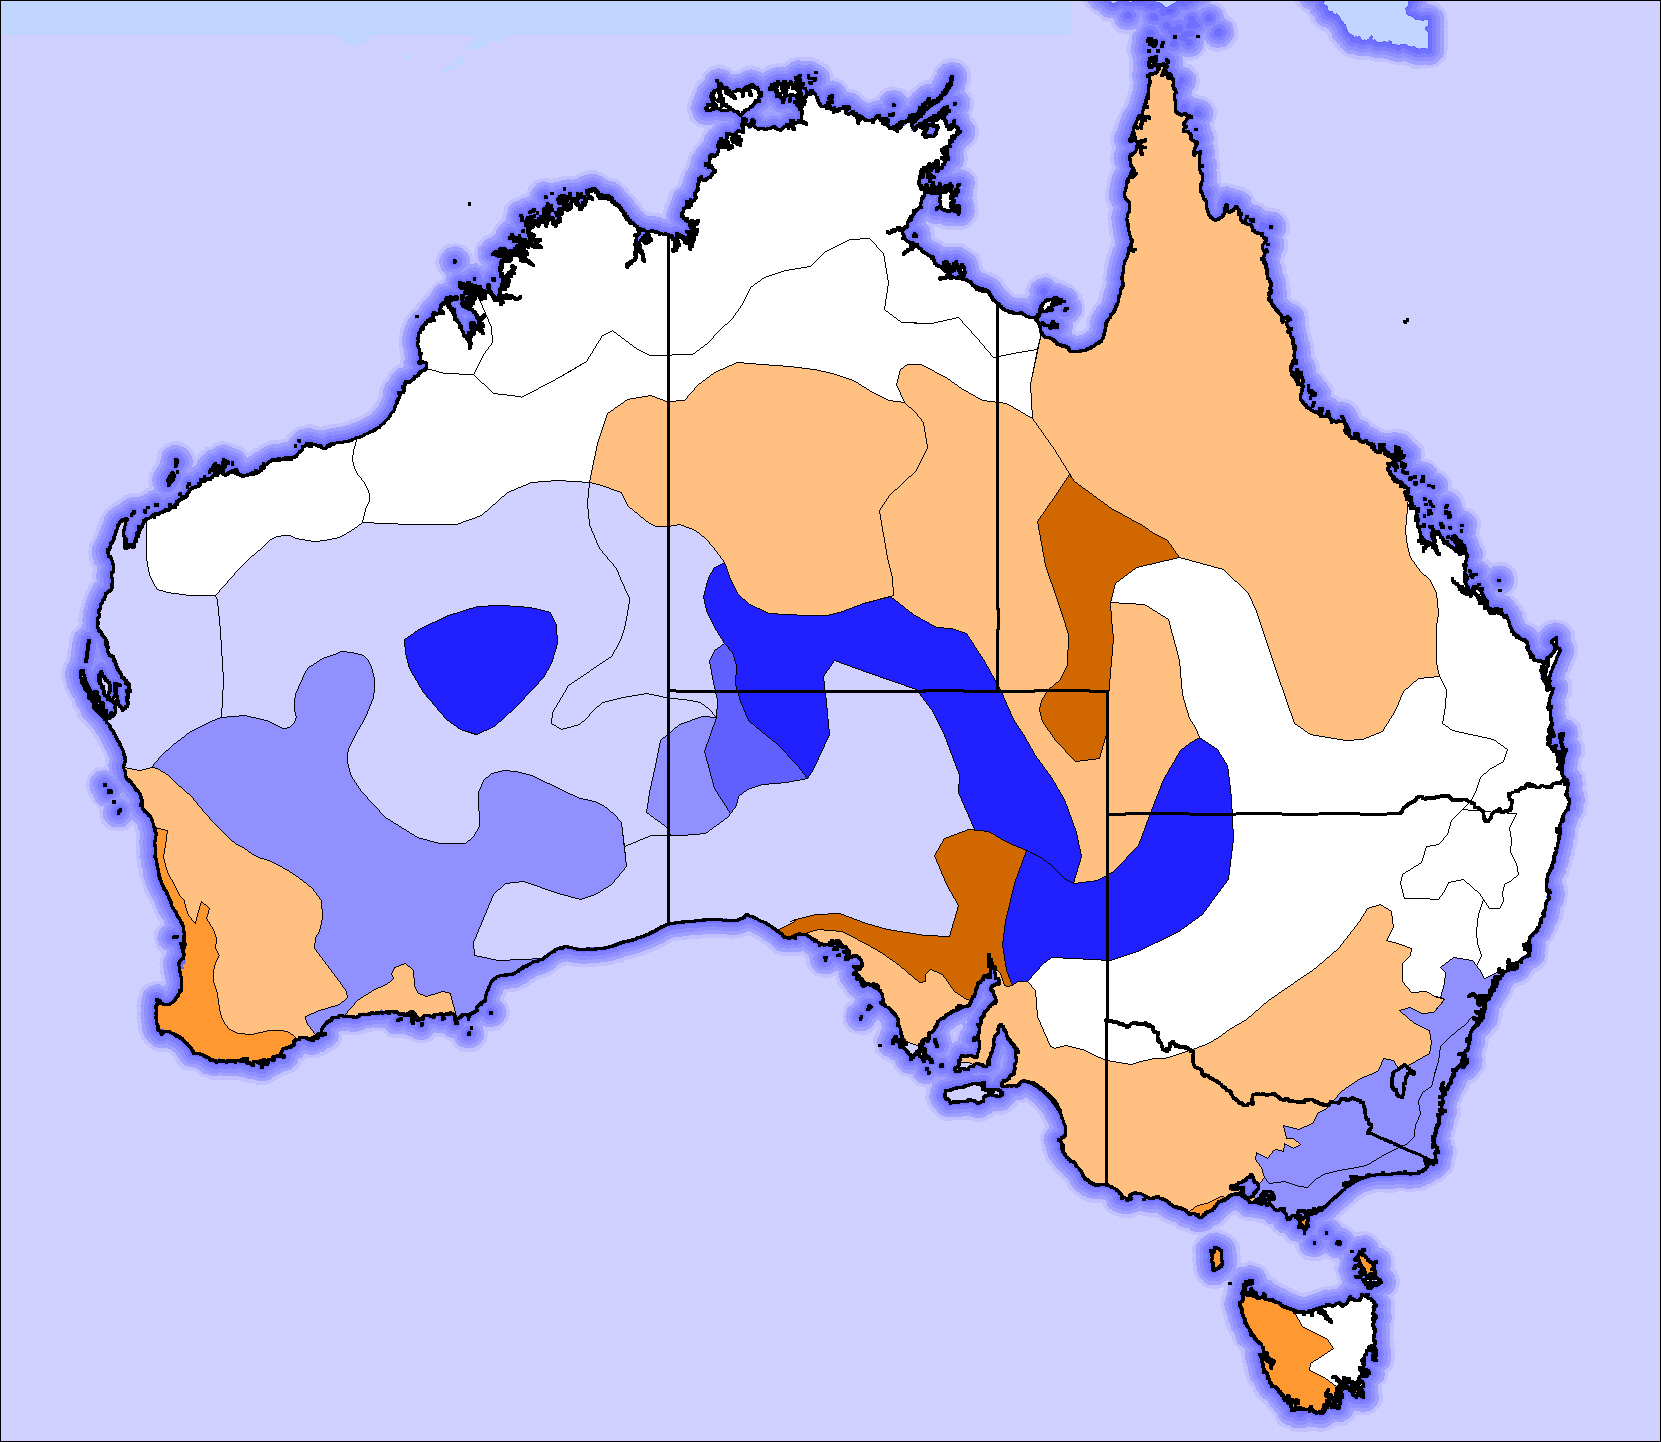
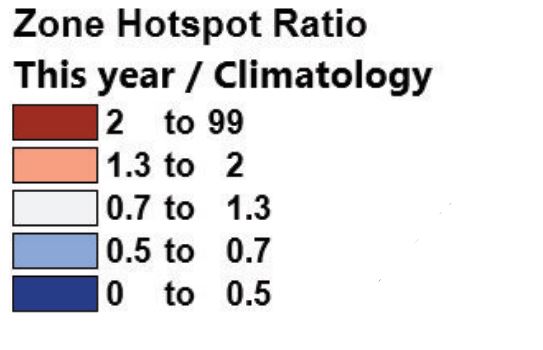
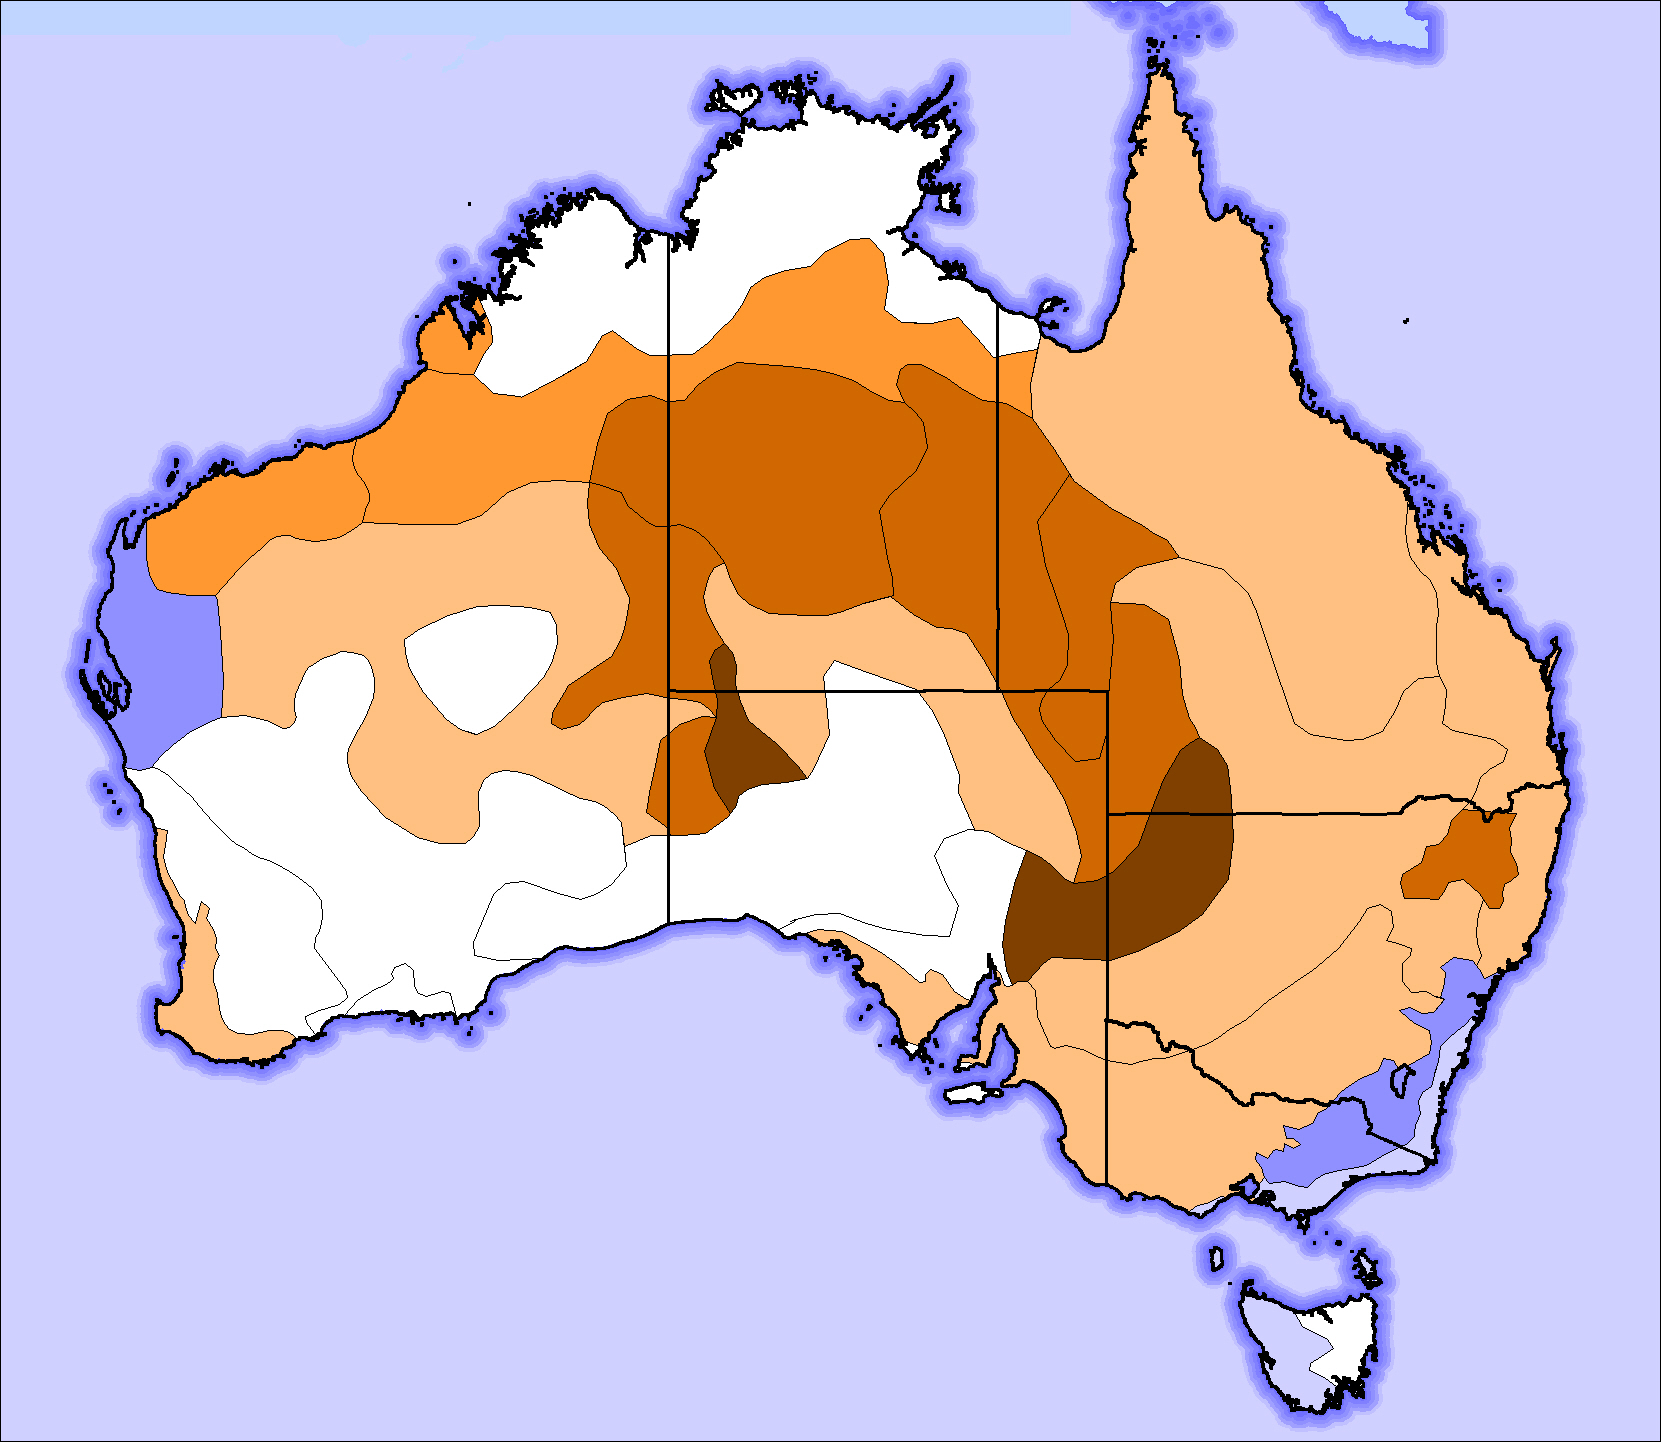
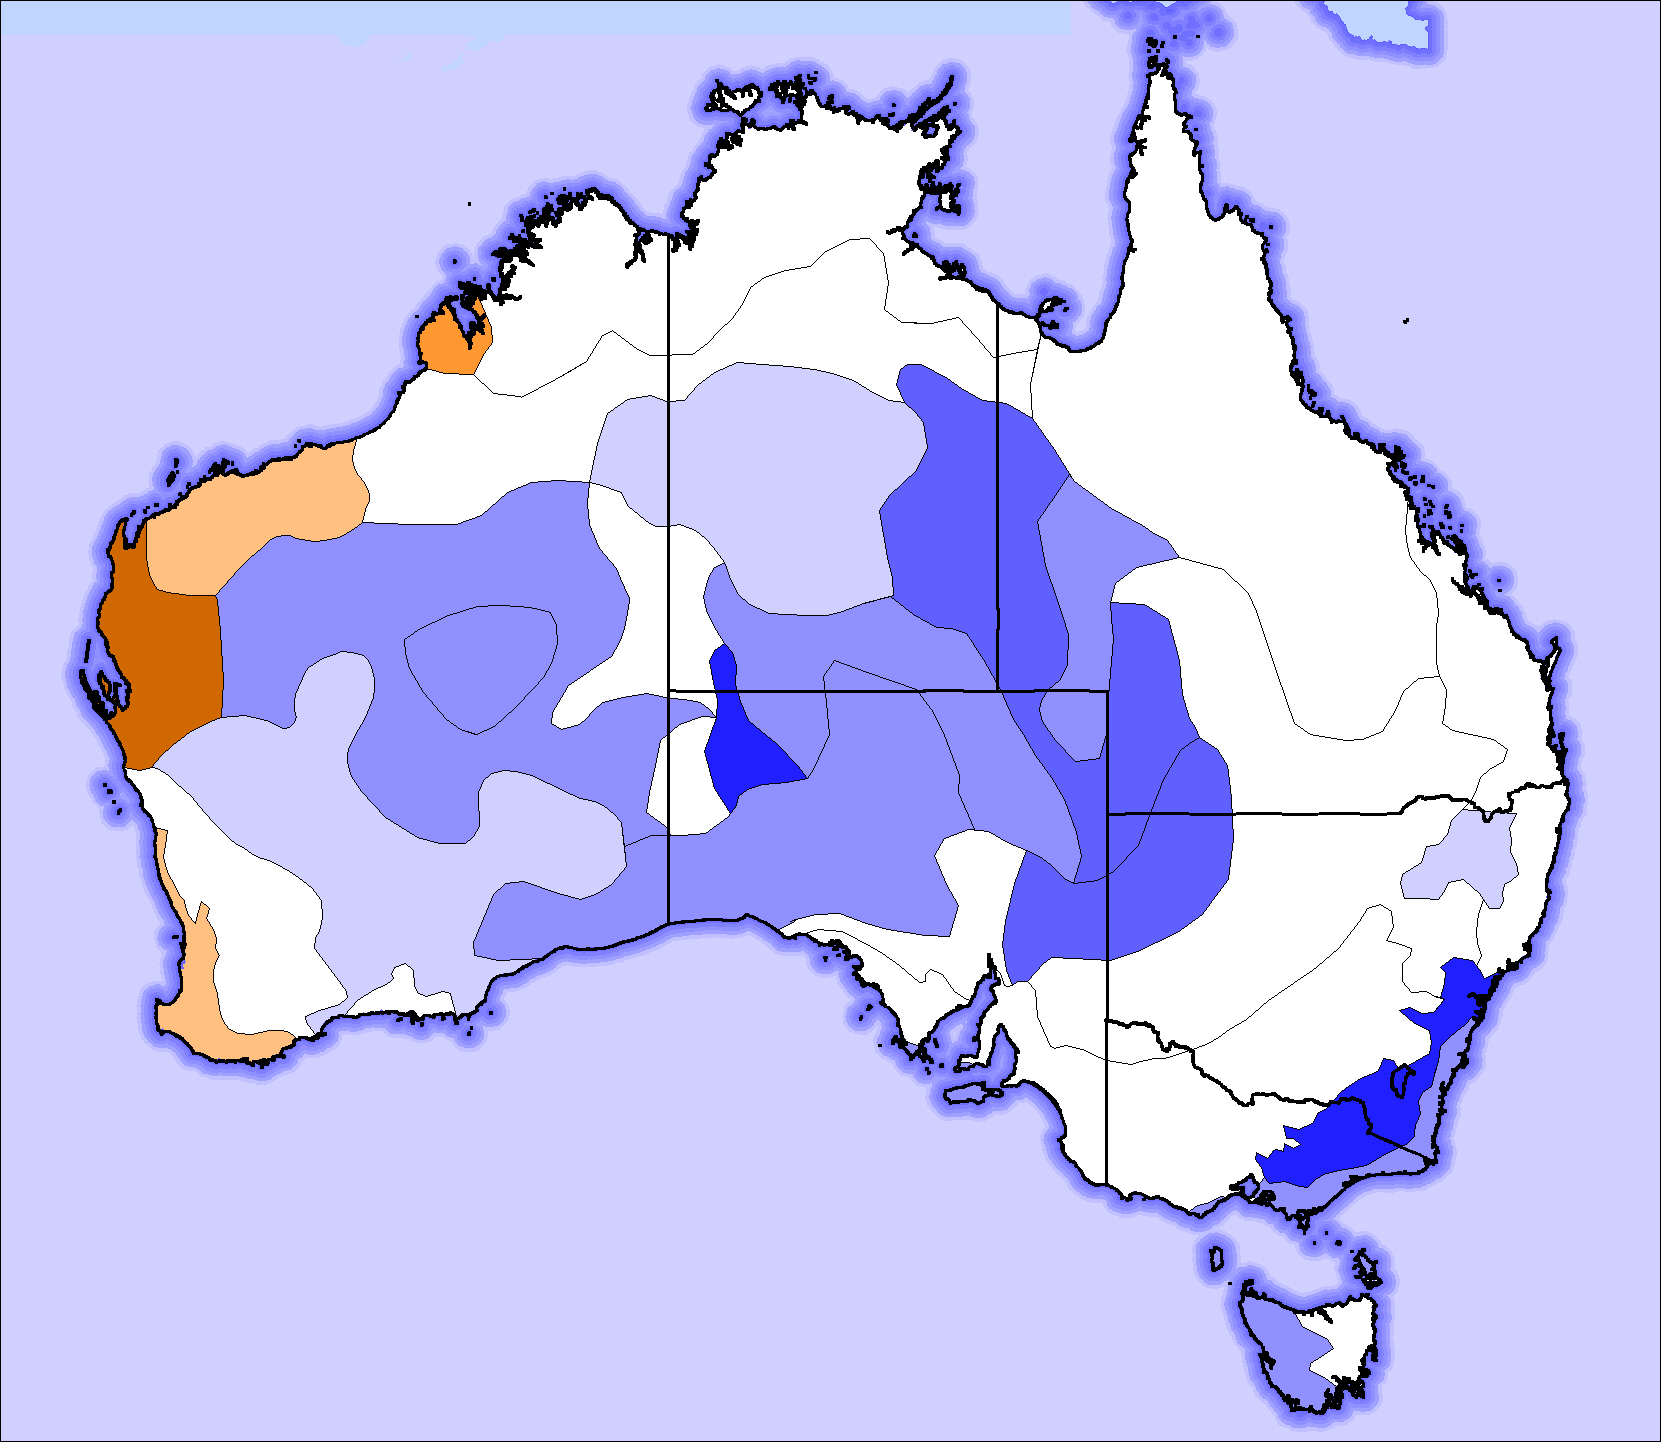
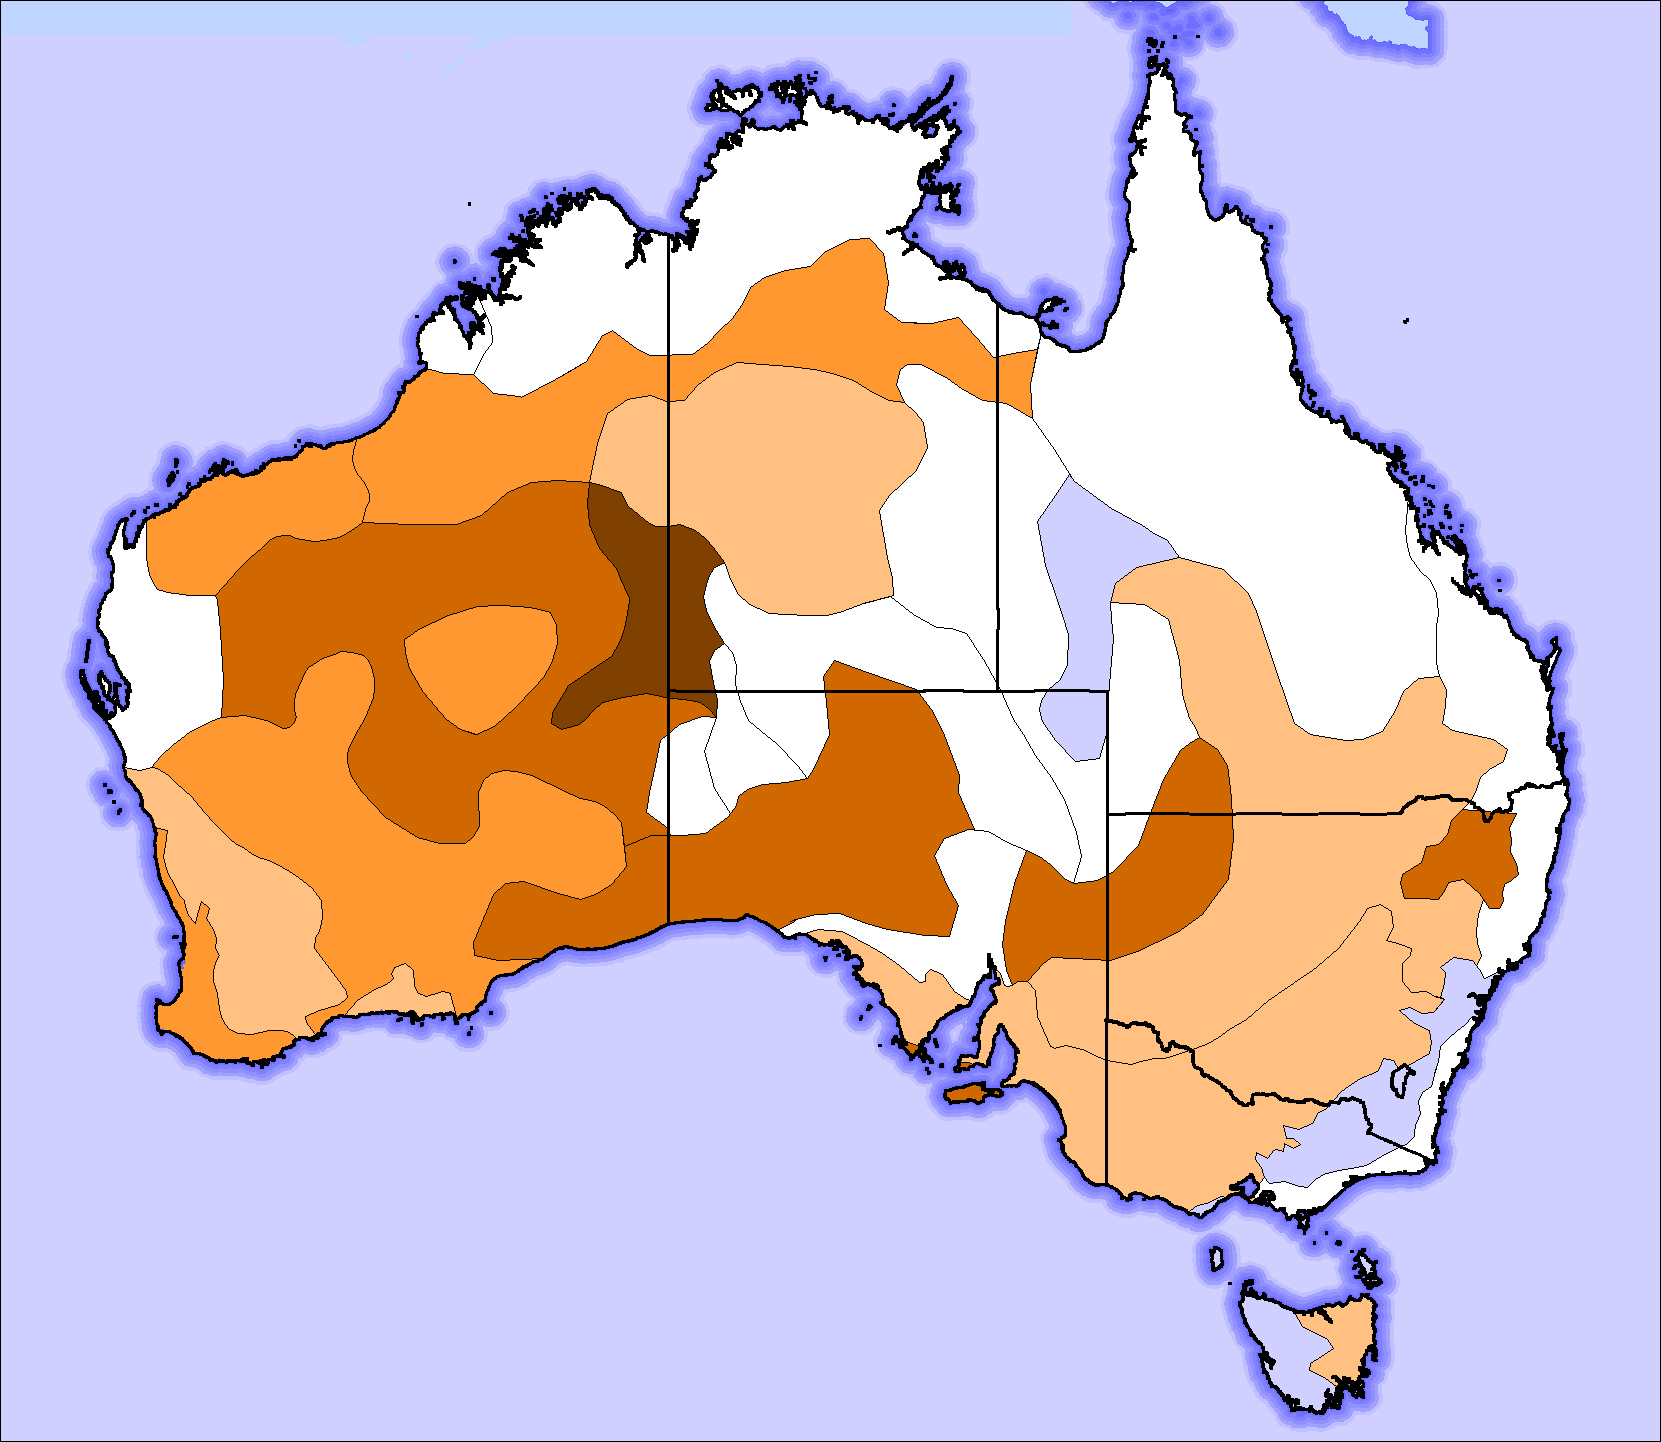
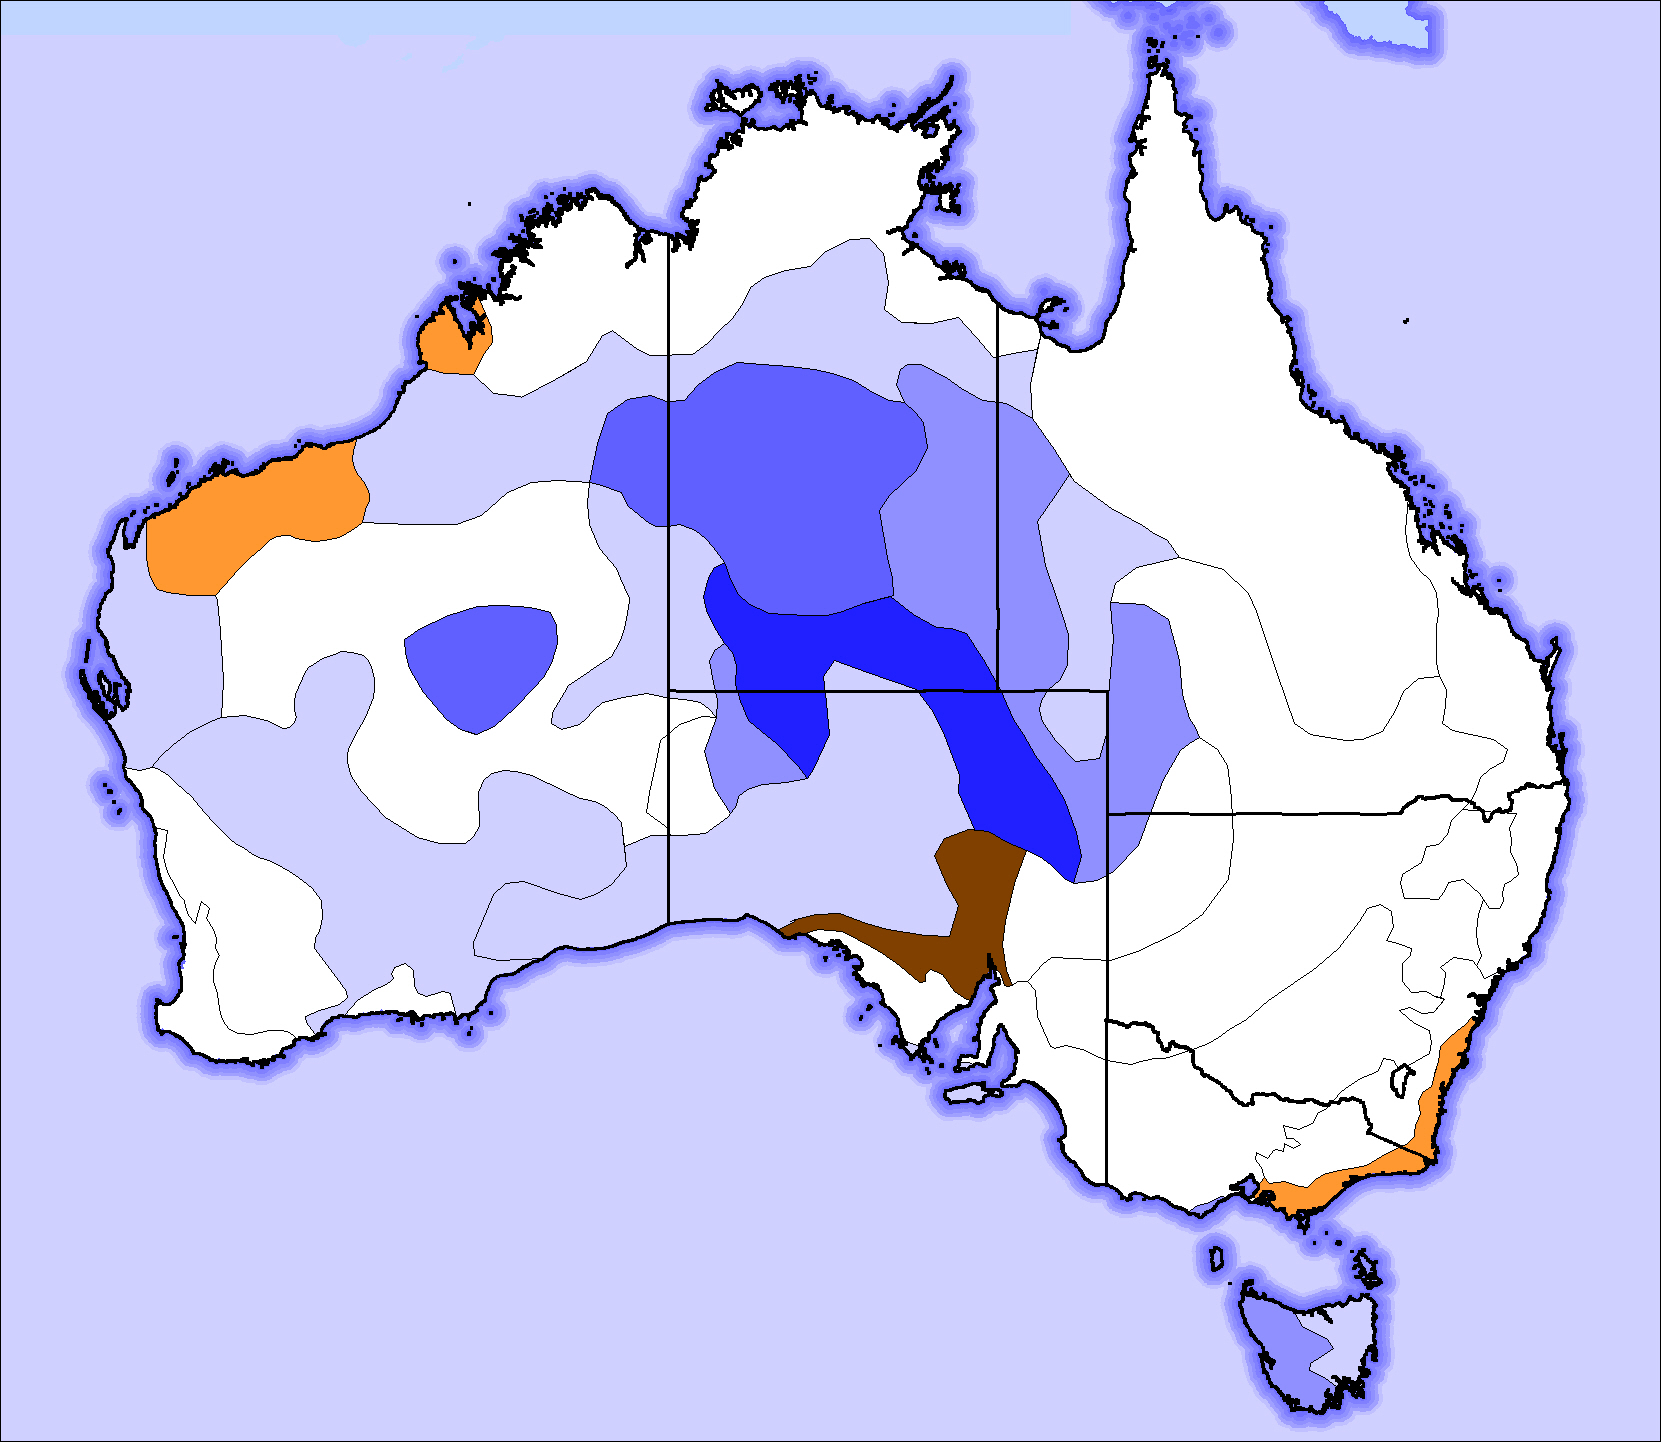
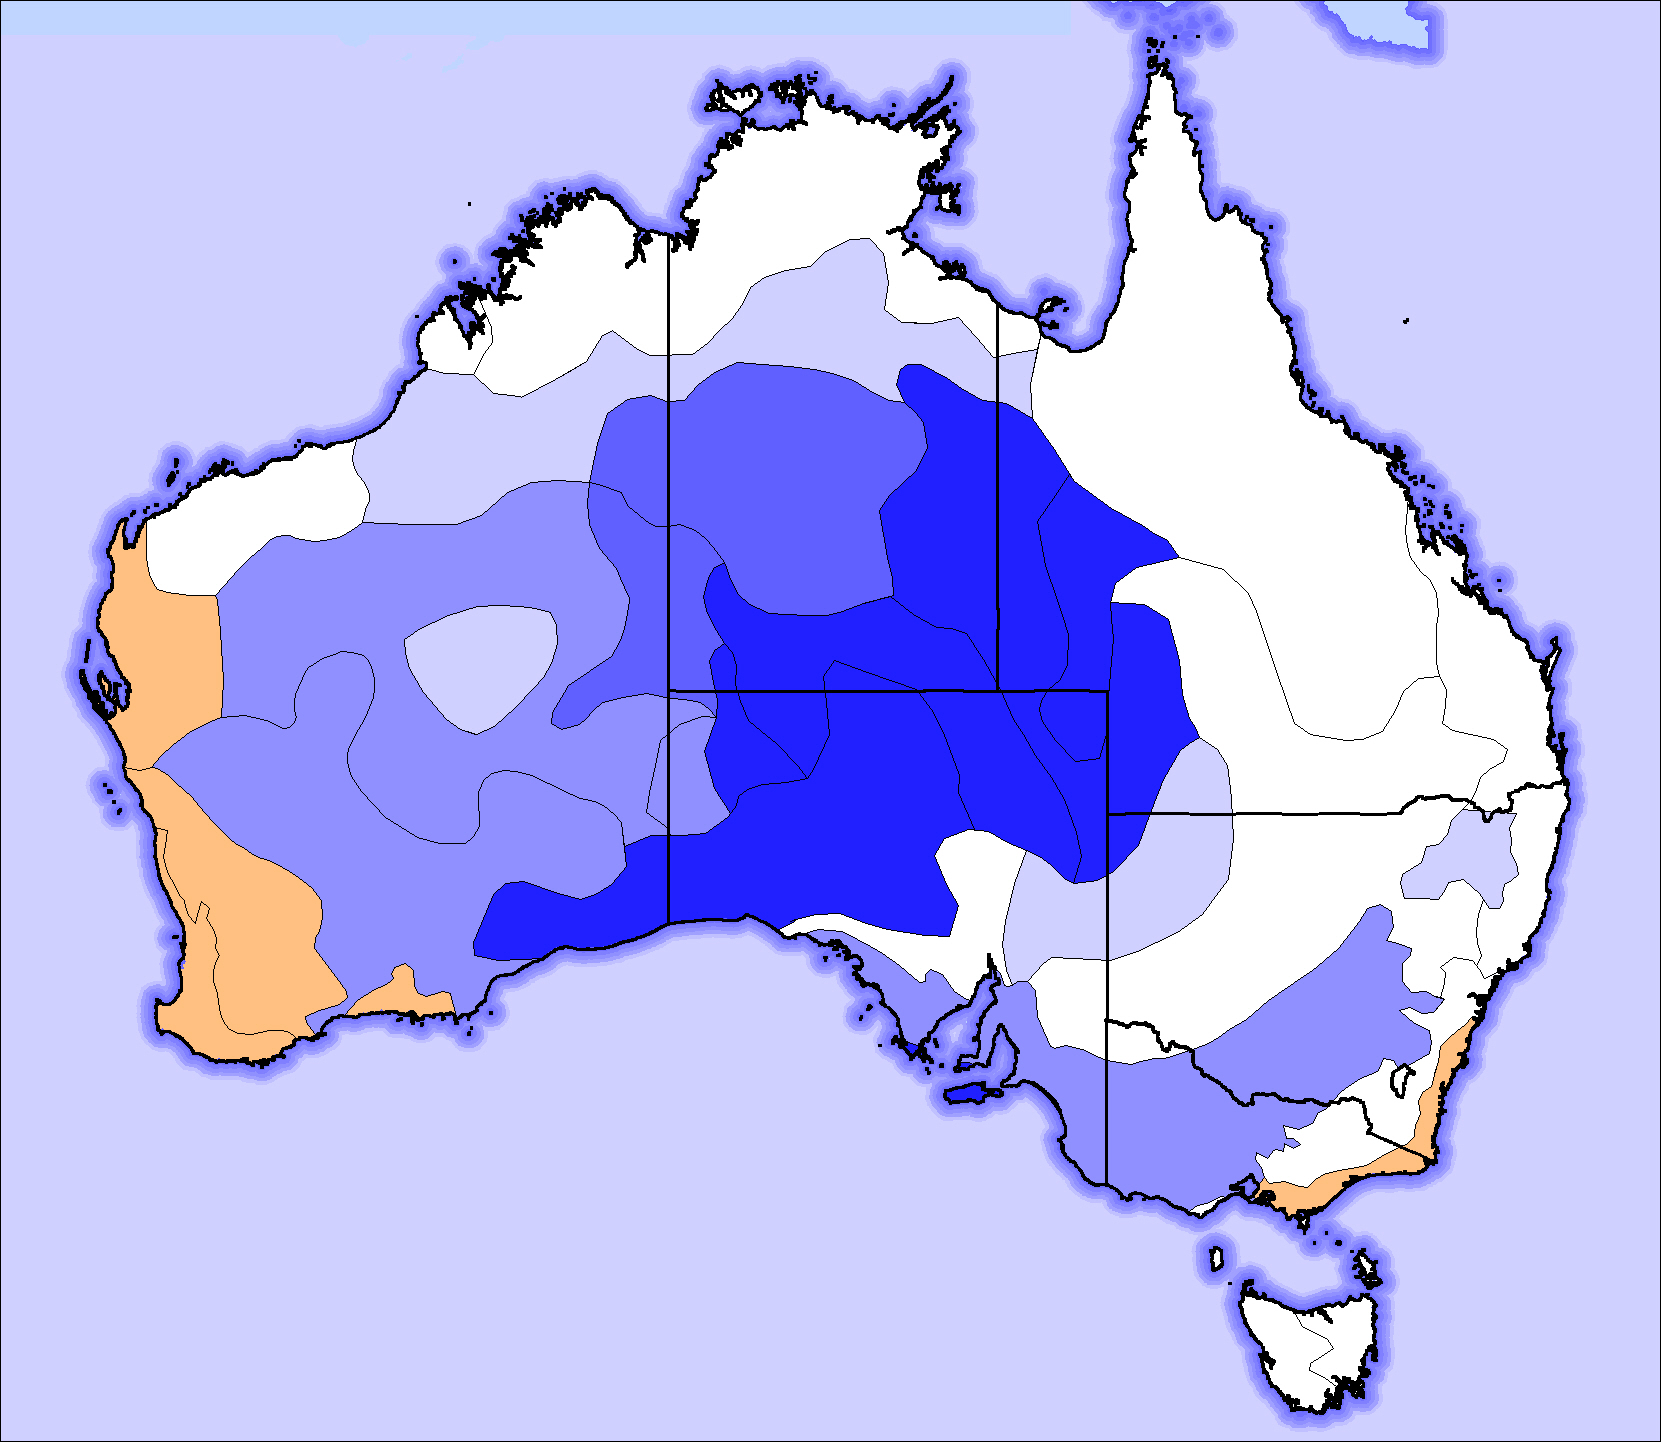
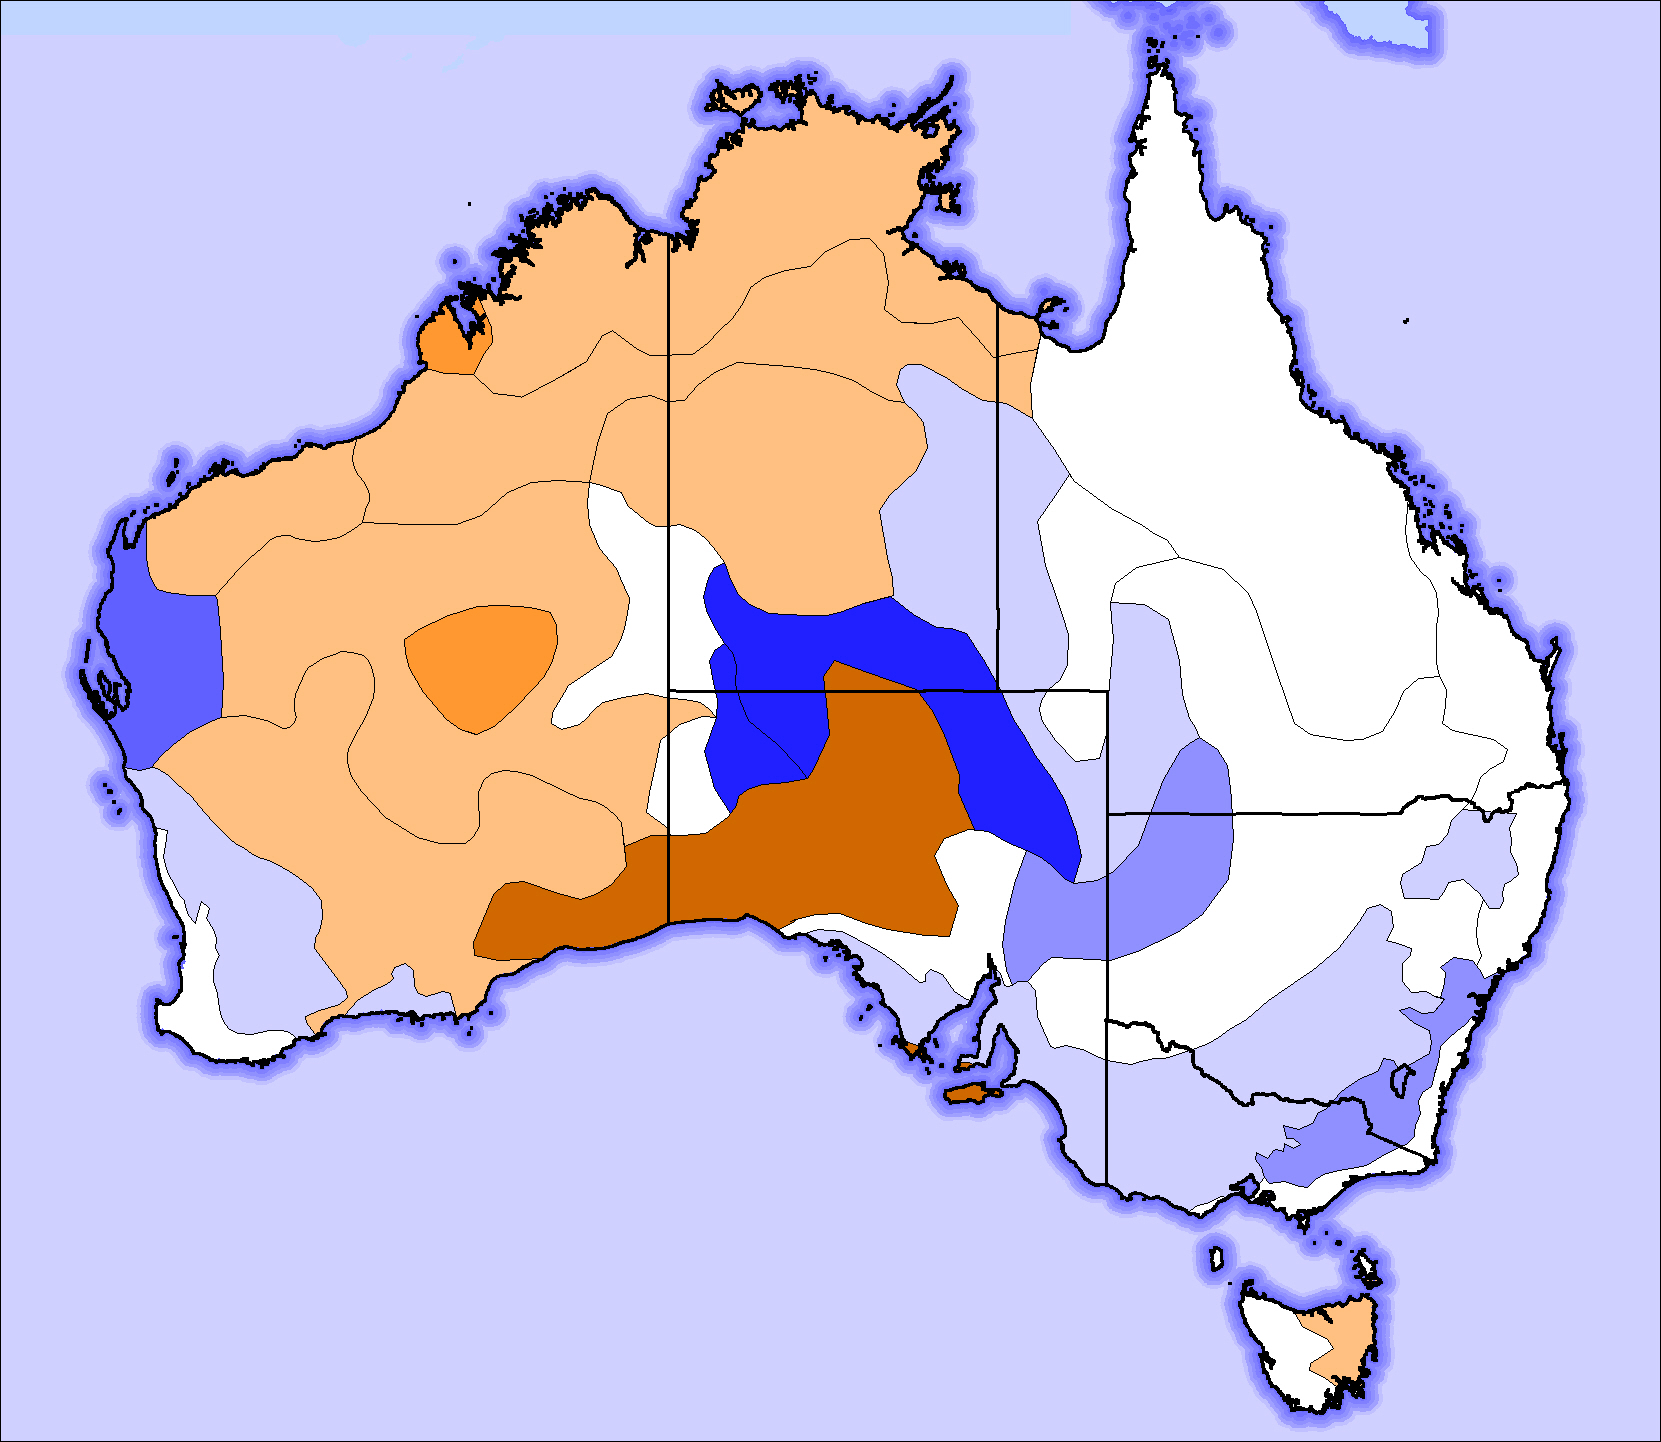
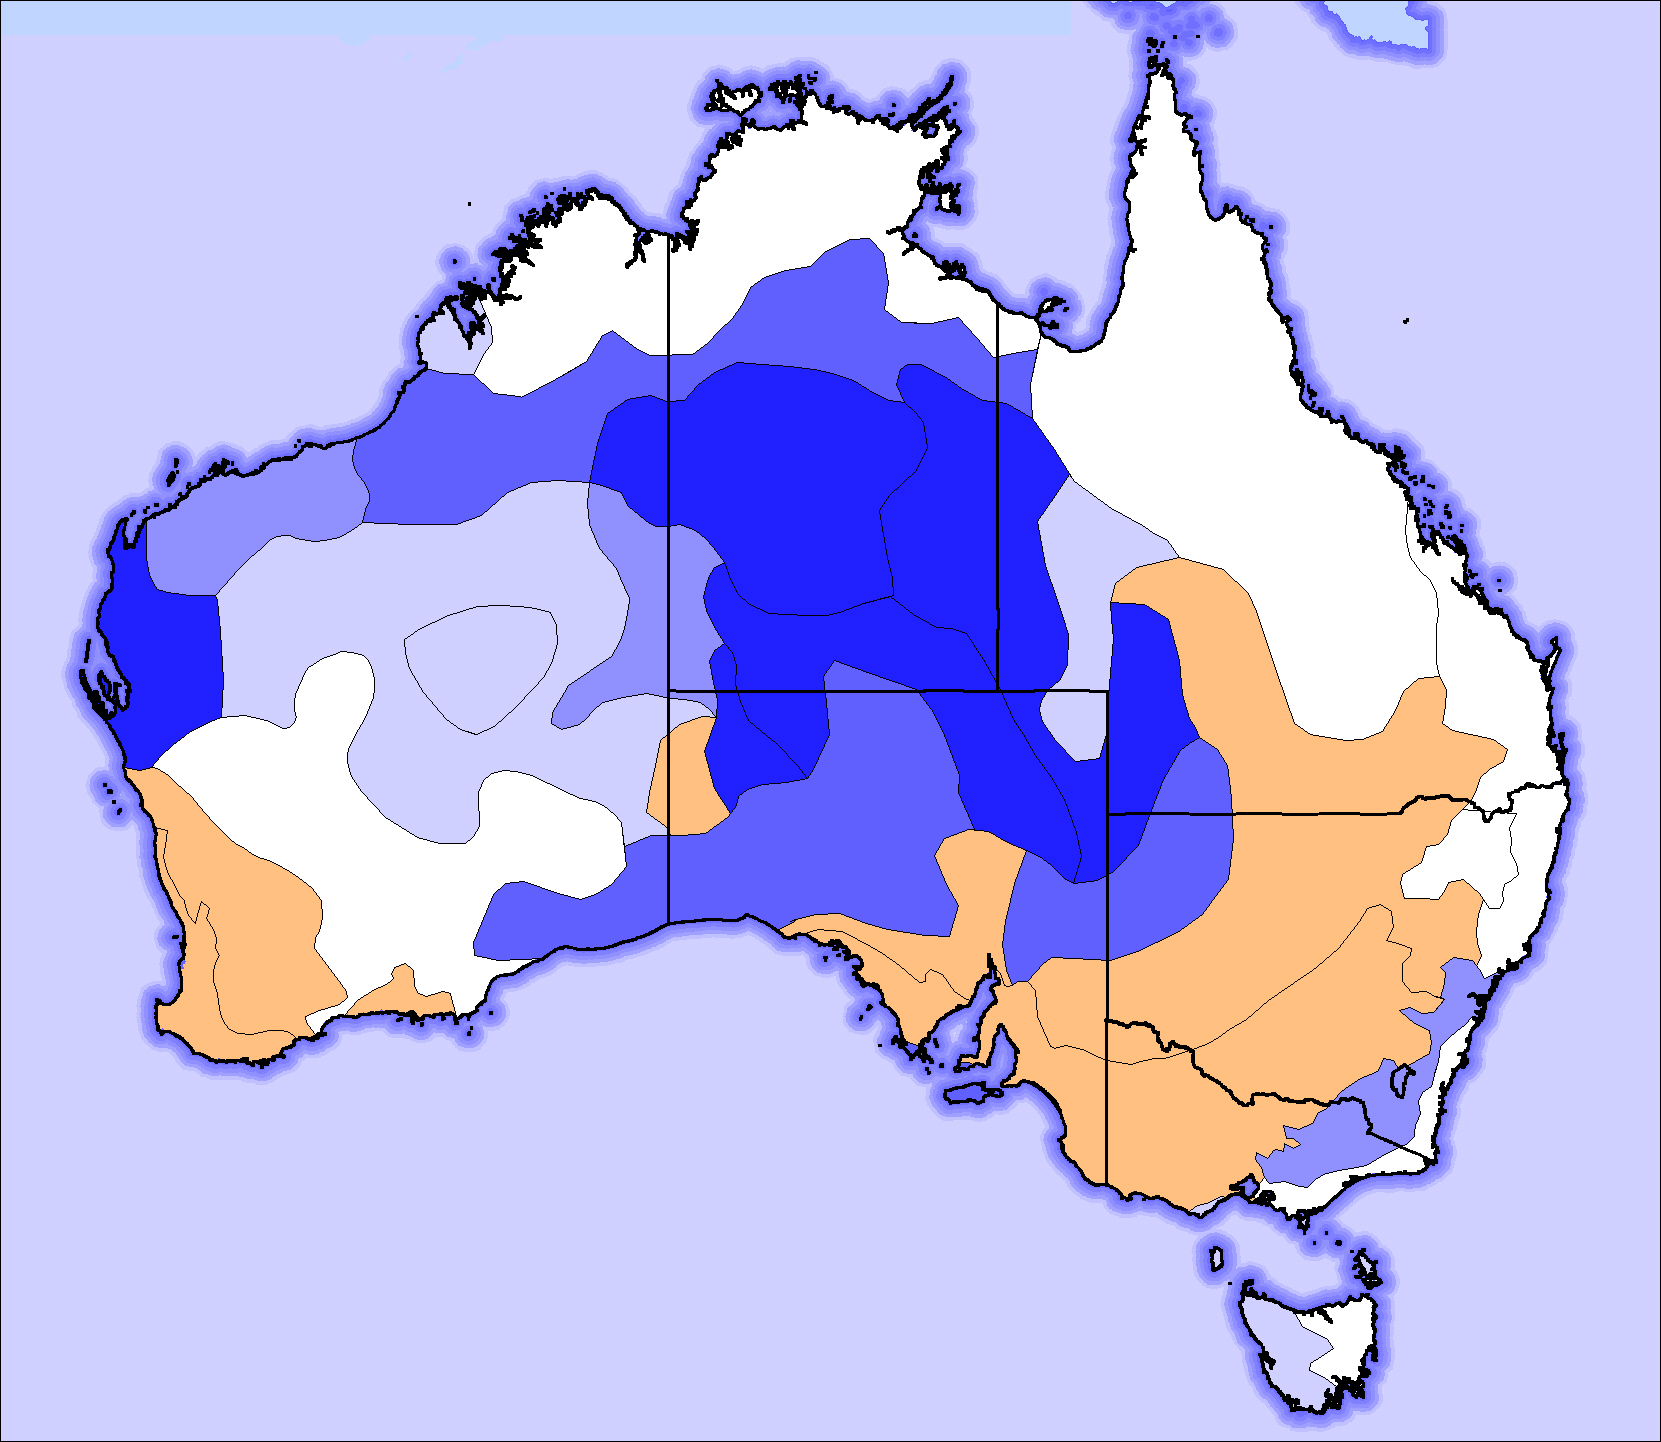
Here is a map of the pattern of hotspot frequency:
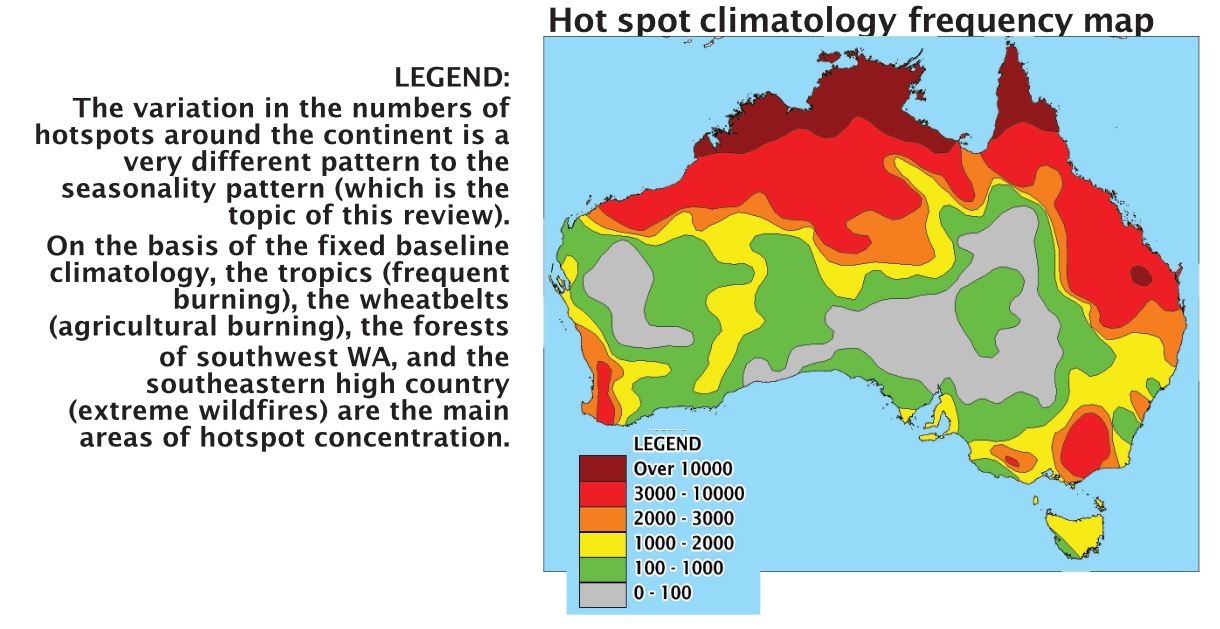
These refer to the fixed climatological baseline, 2002 to 2014. It is clear that climate change is having significant impacts on Australia's fire seasonality patterns, making the fixed baseline important.
In all cases the fire year spans from July to June, so that the Austral summer season is not split.
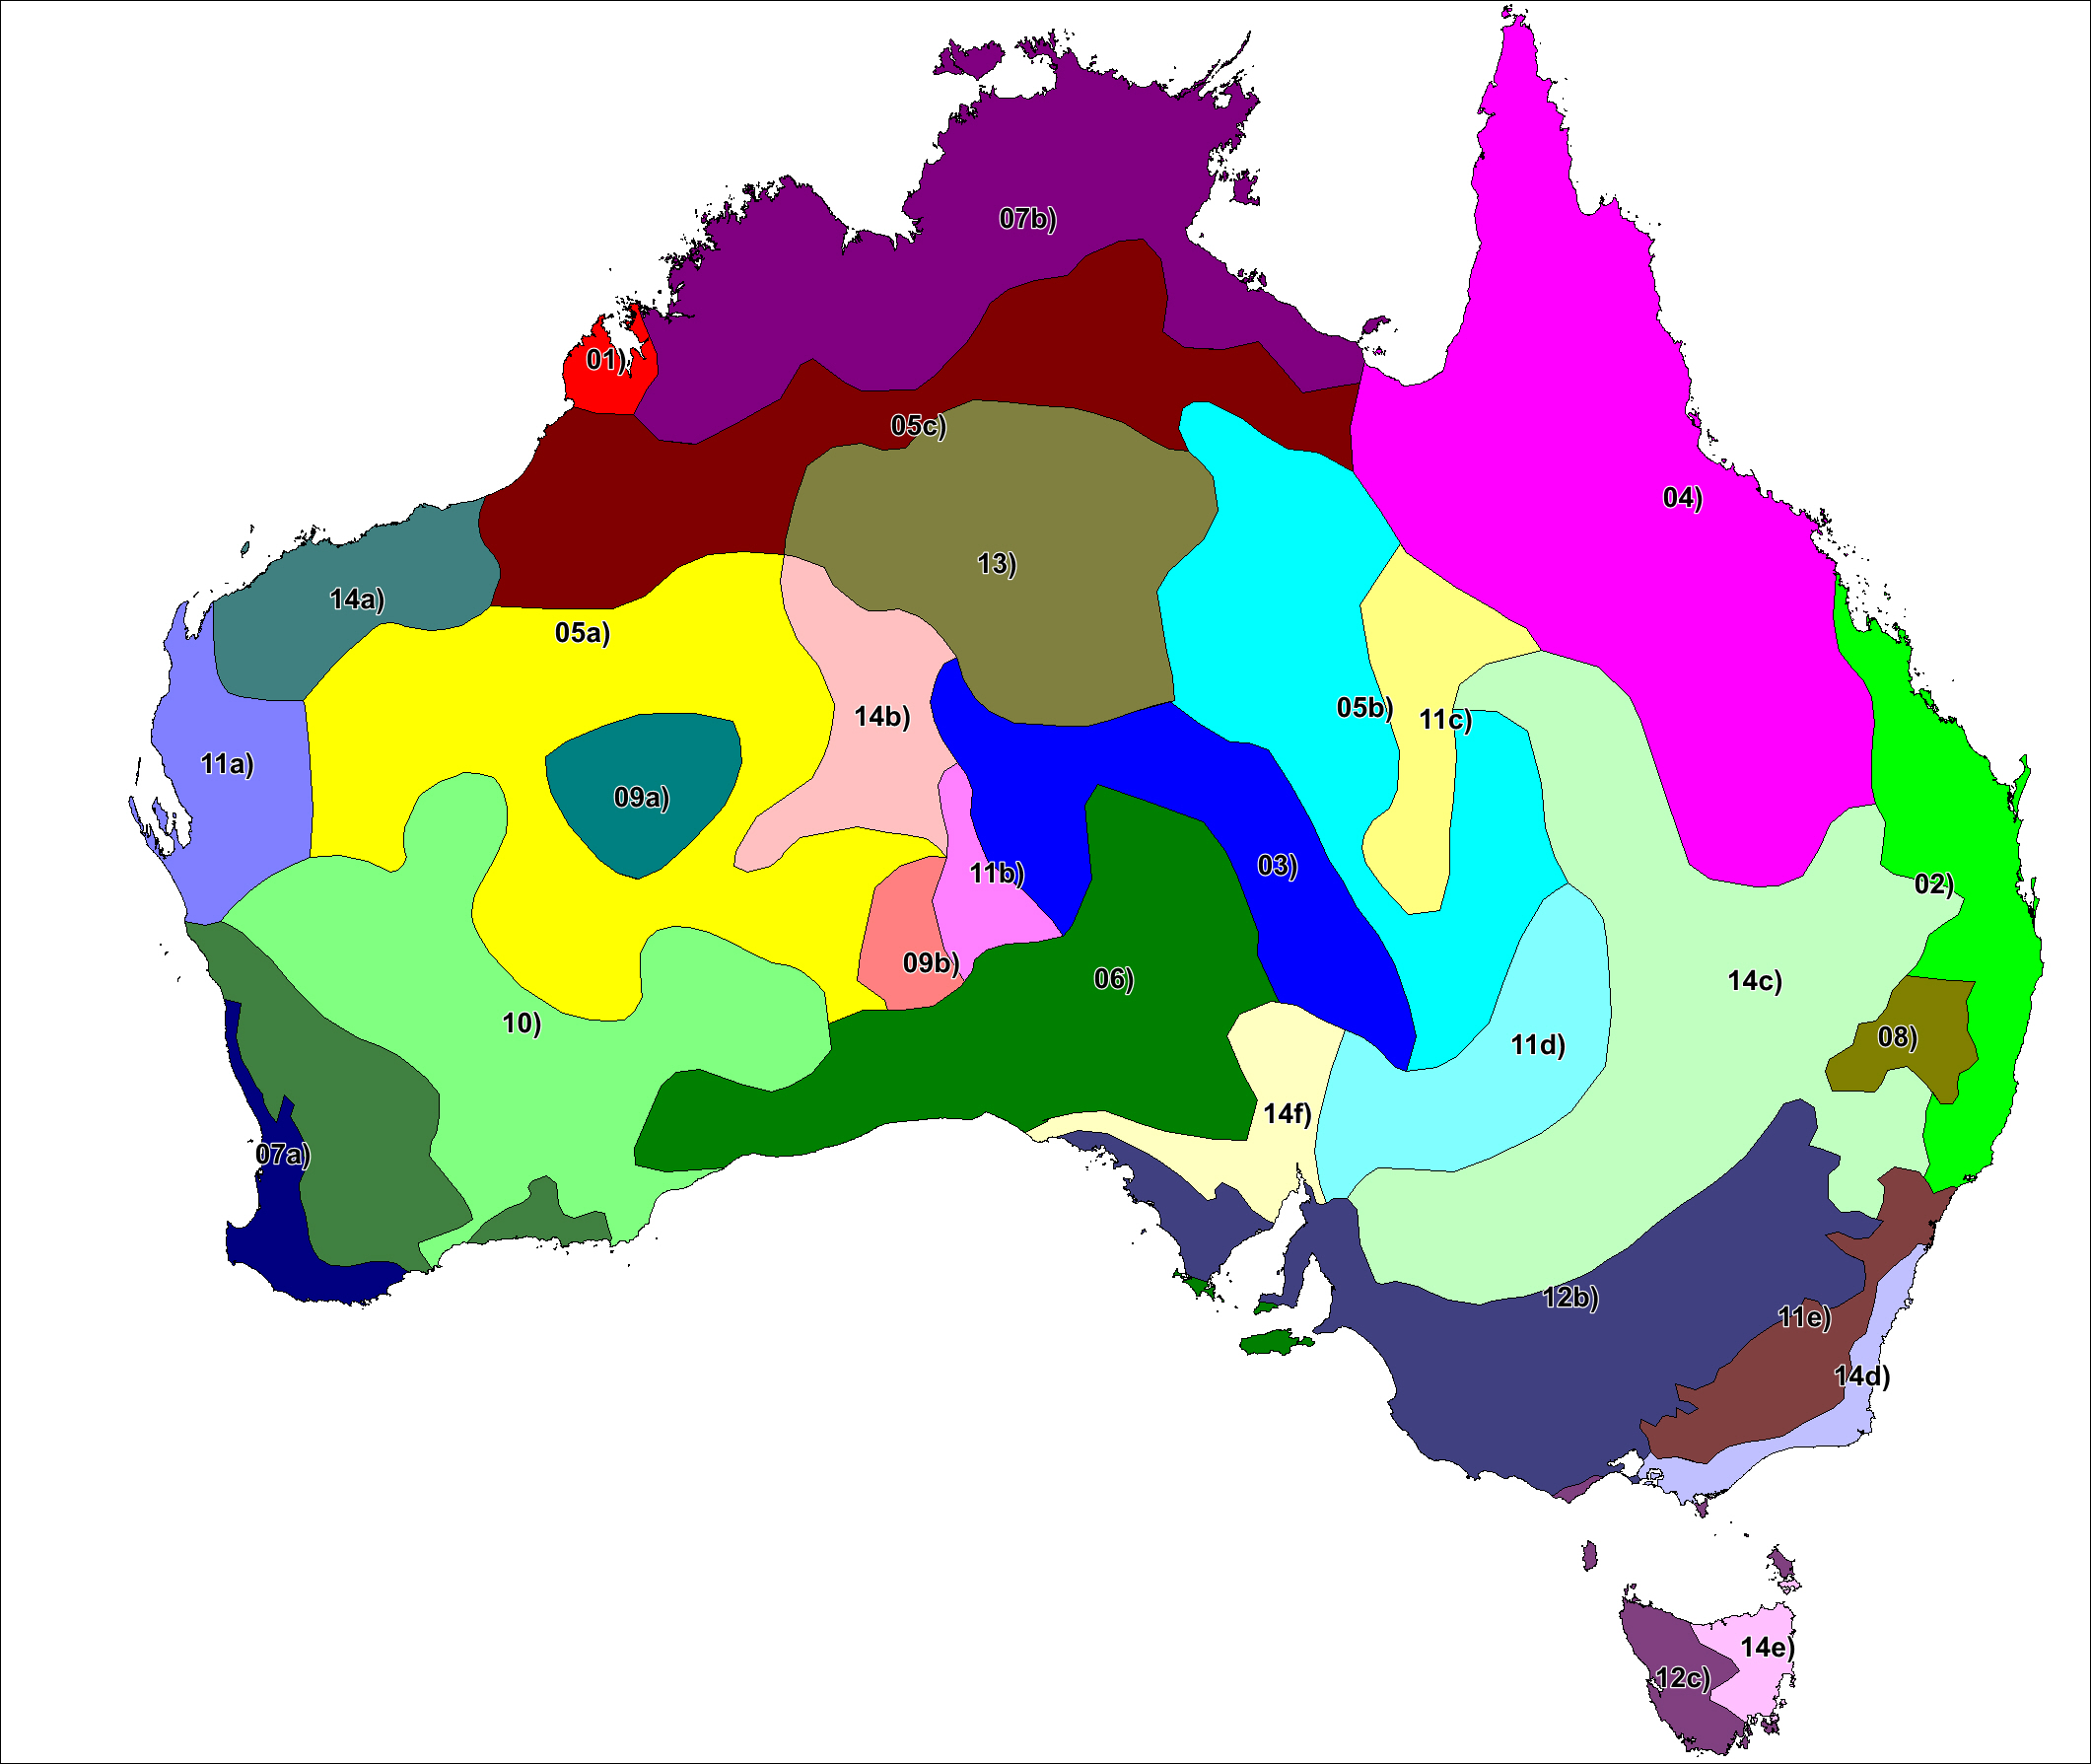
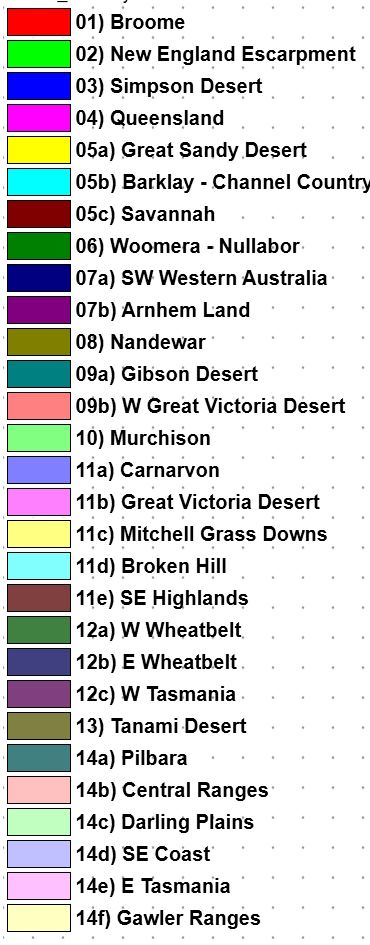
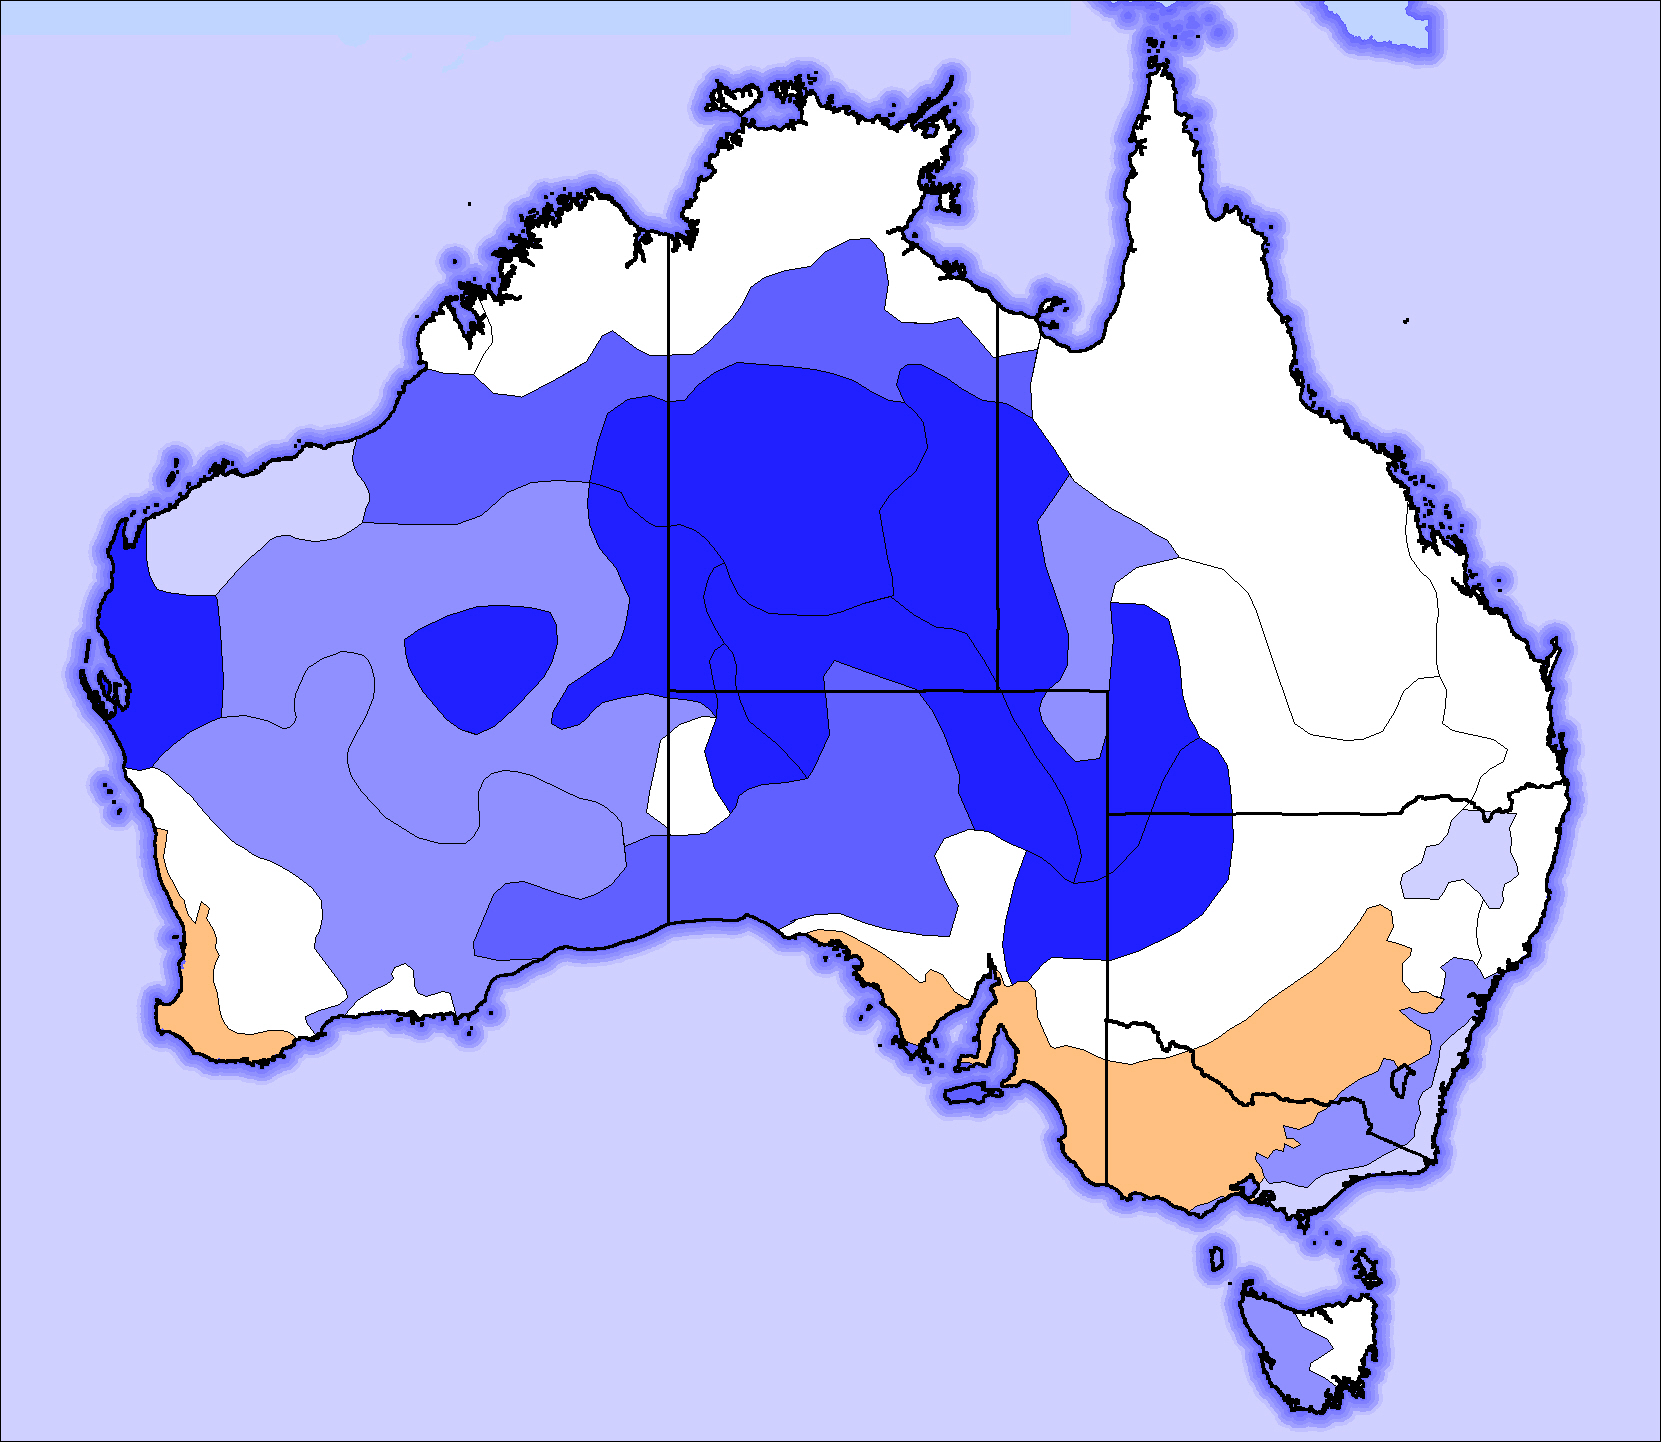
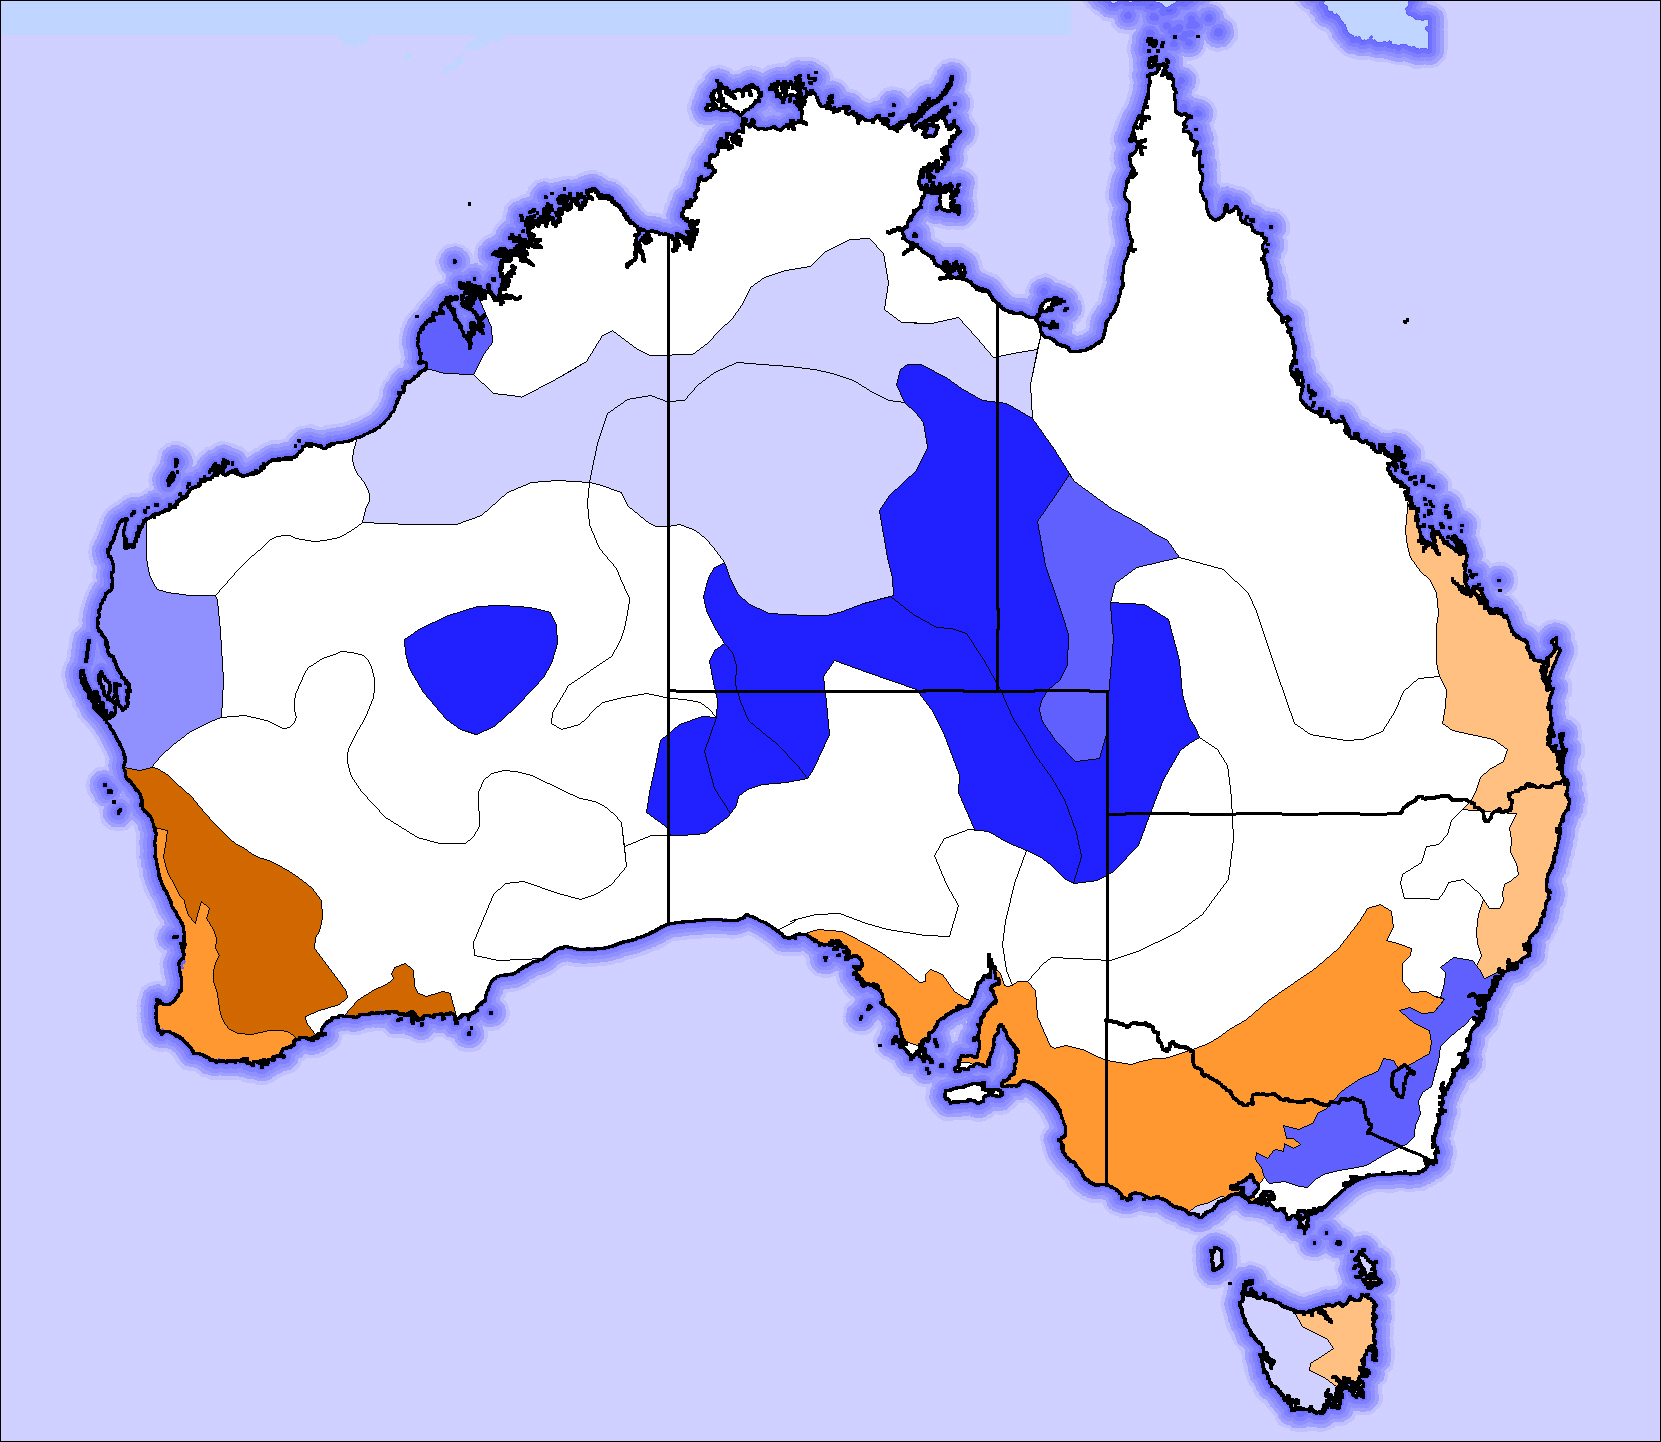
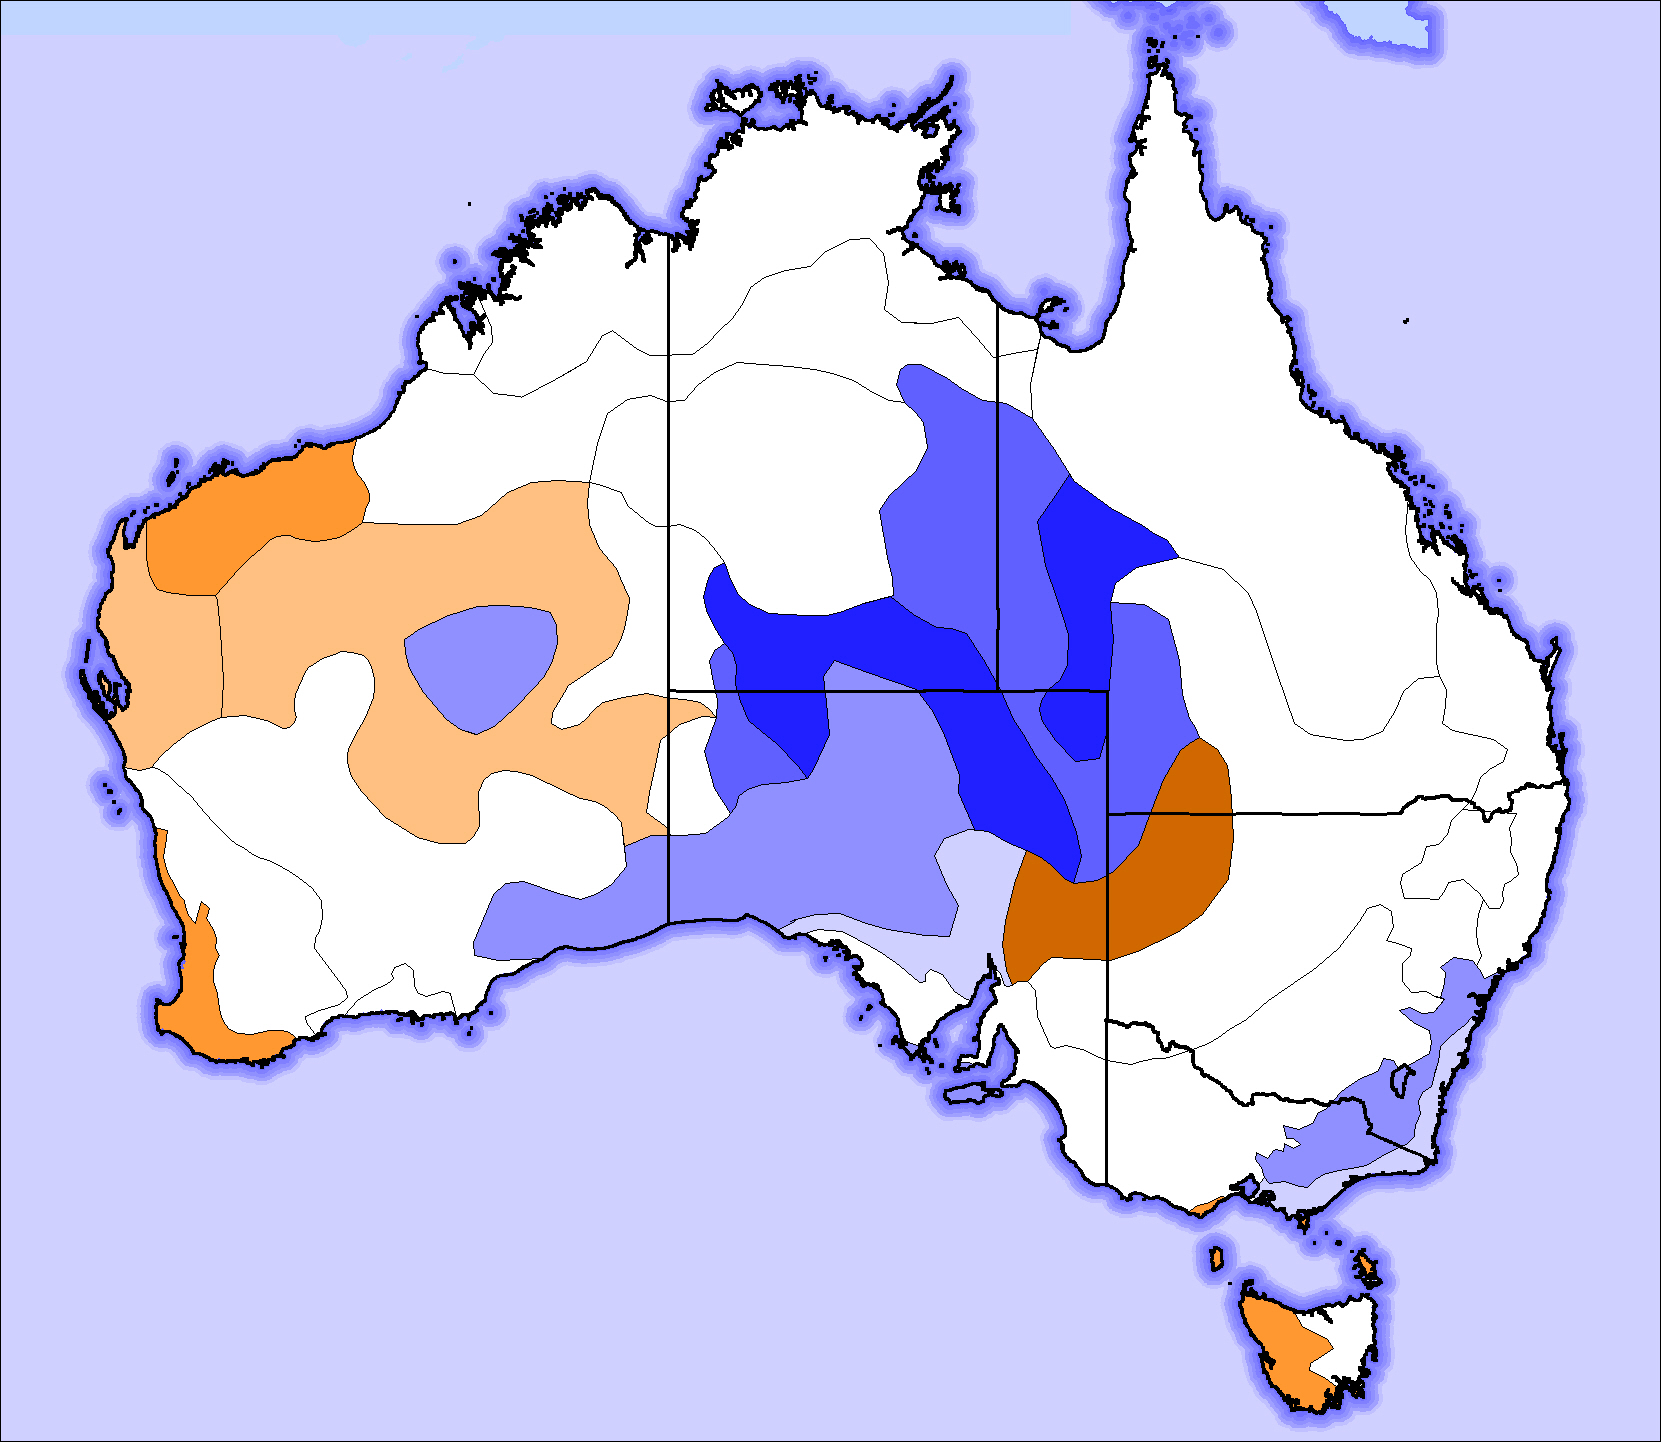
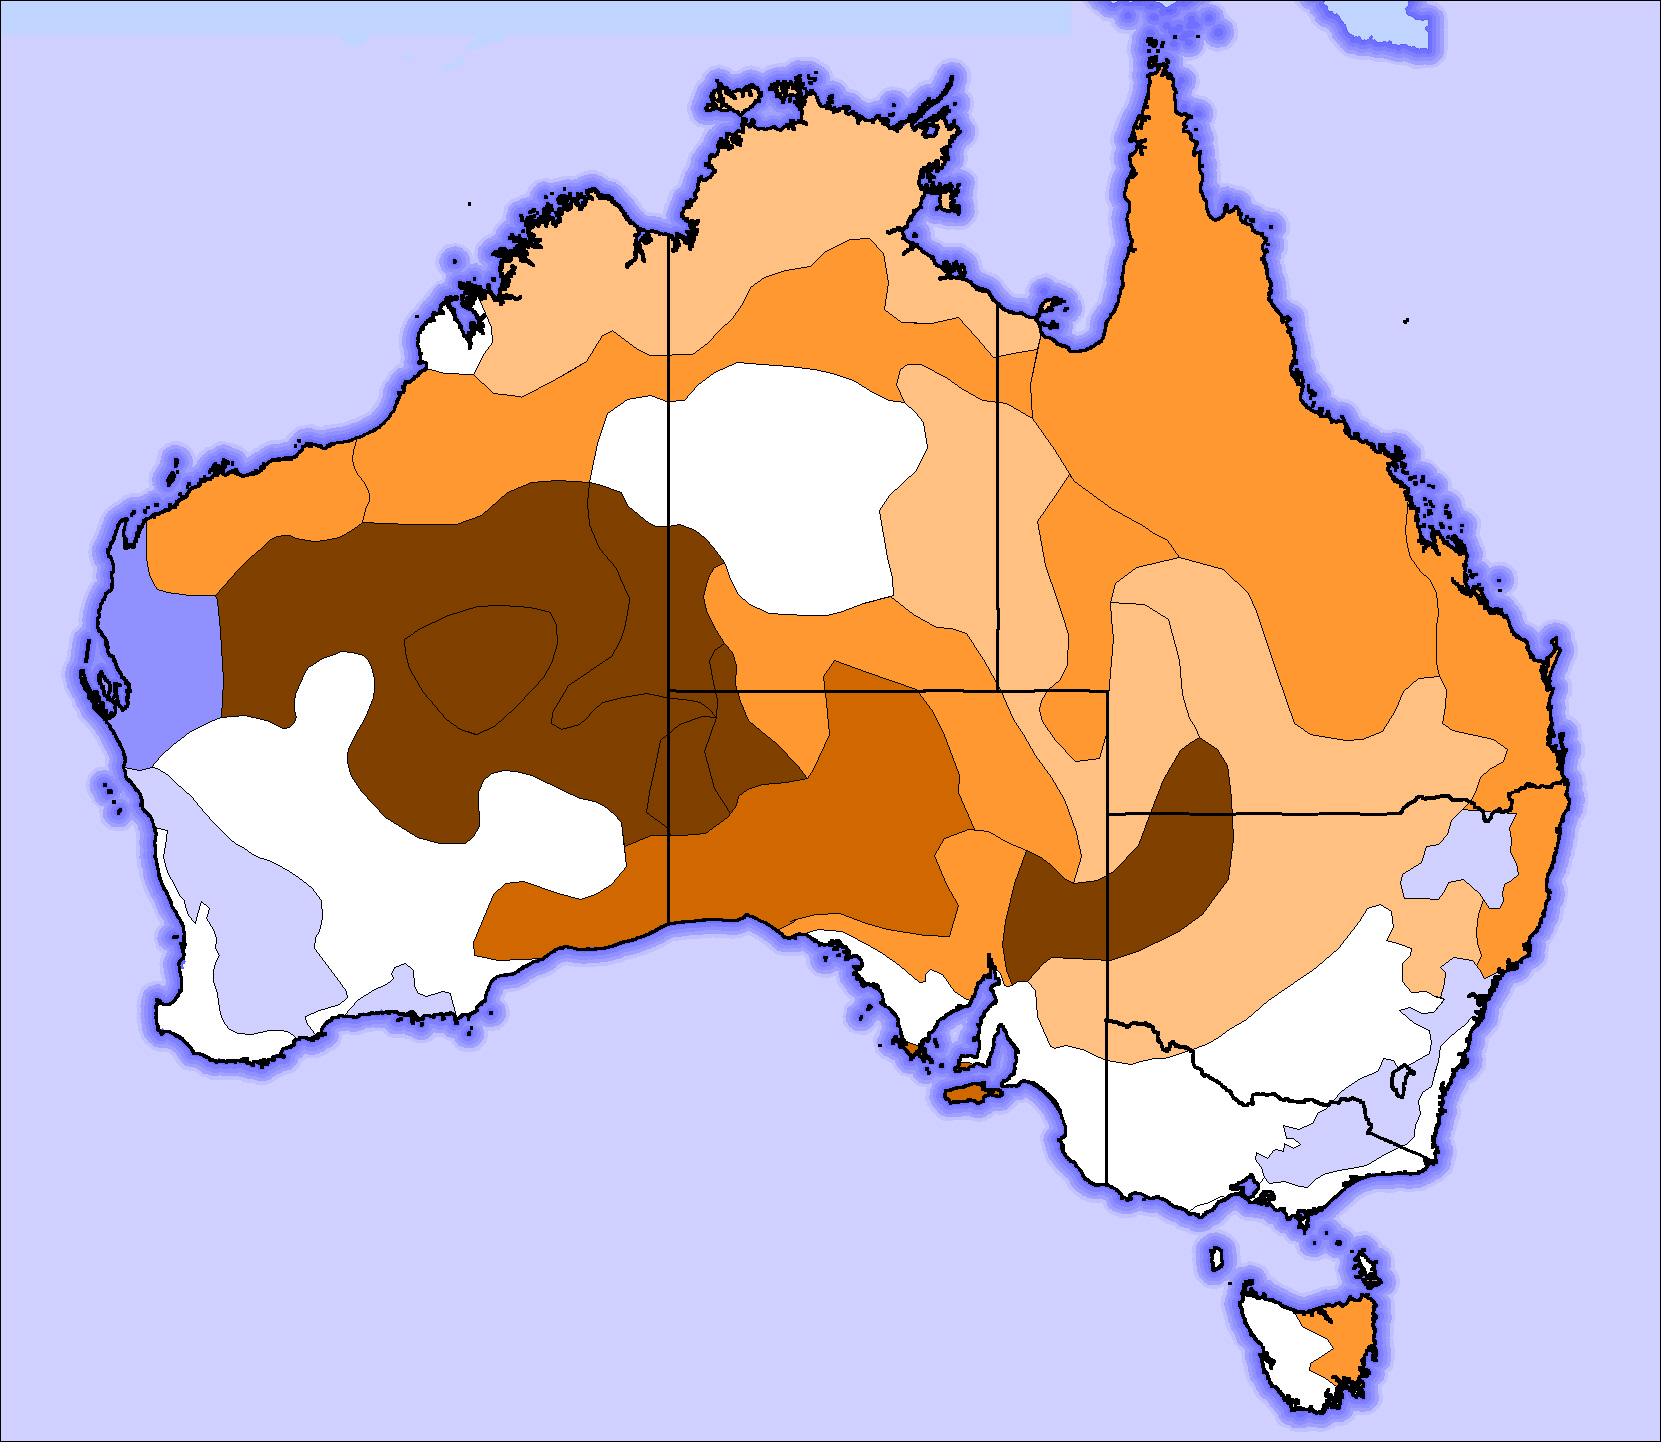
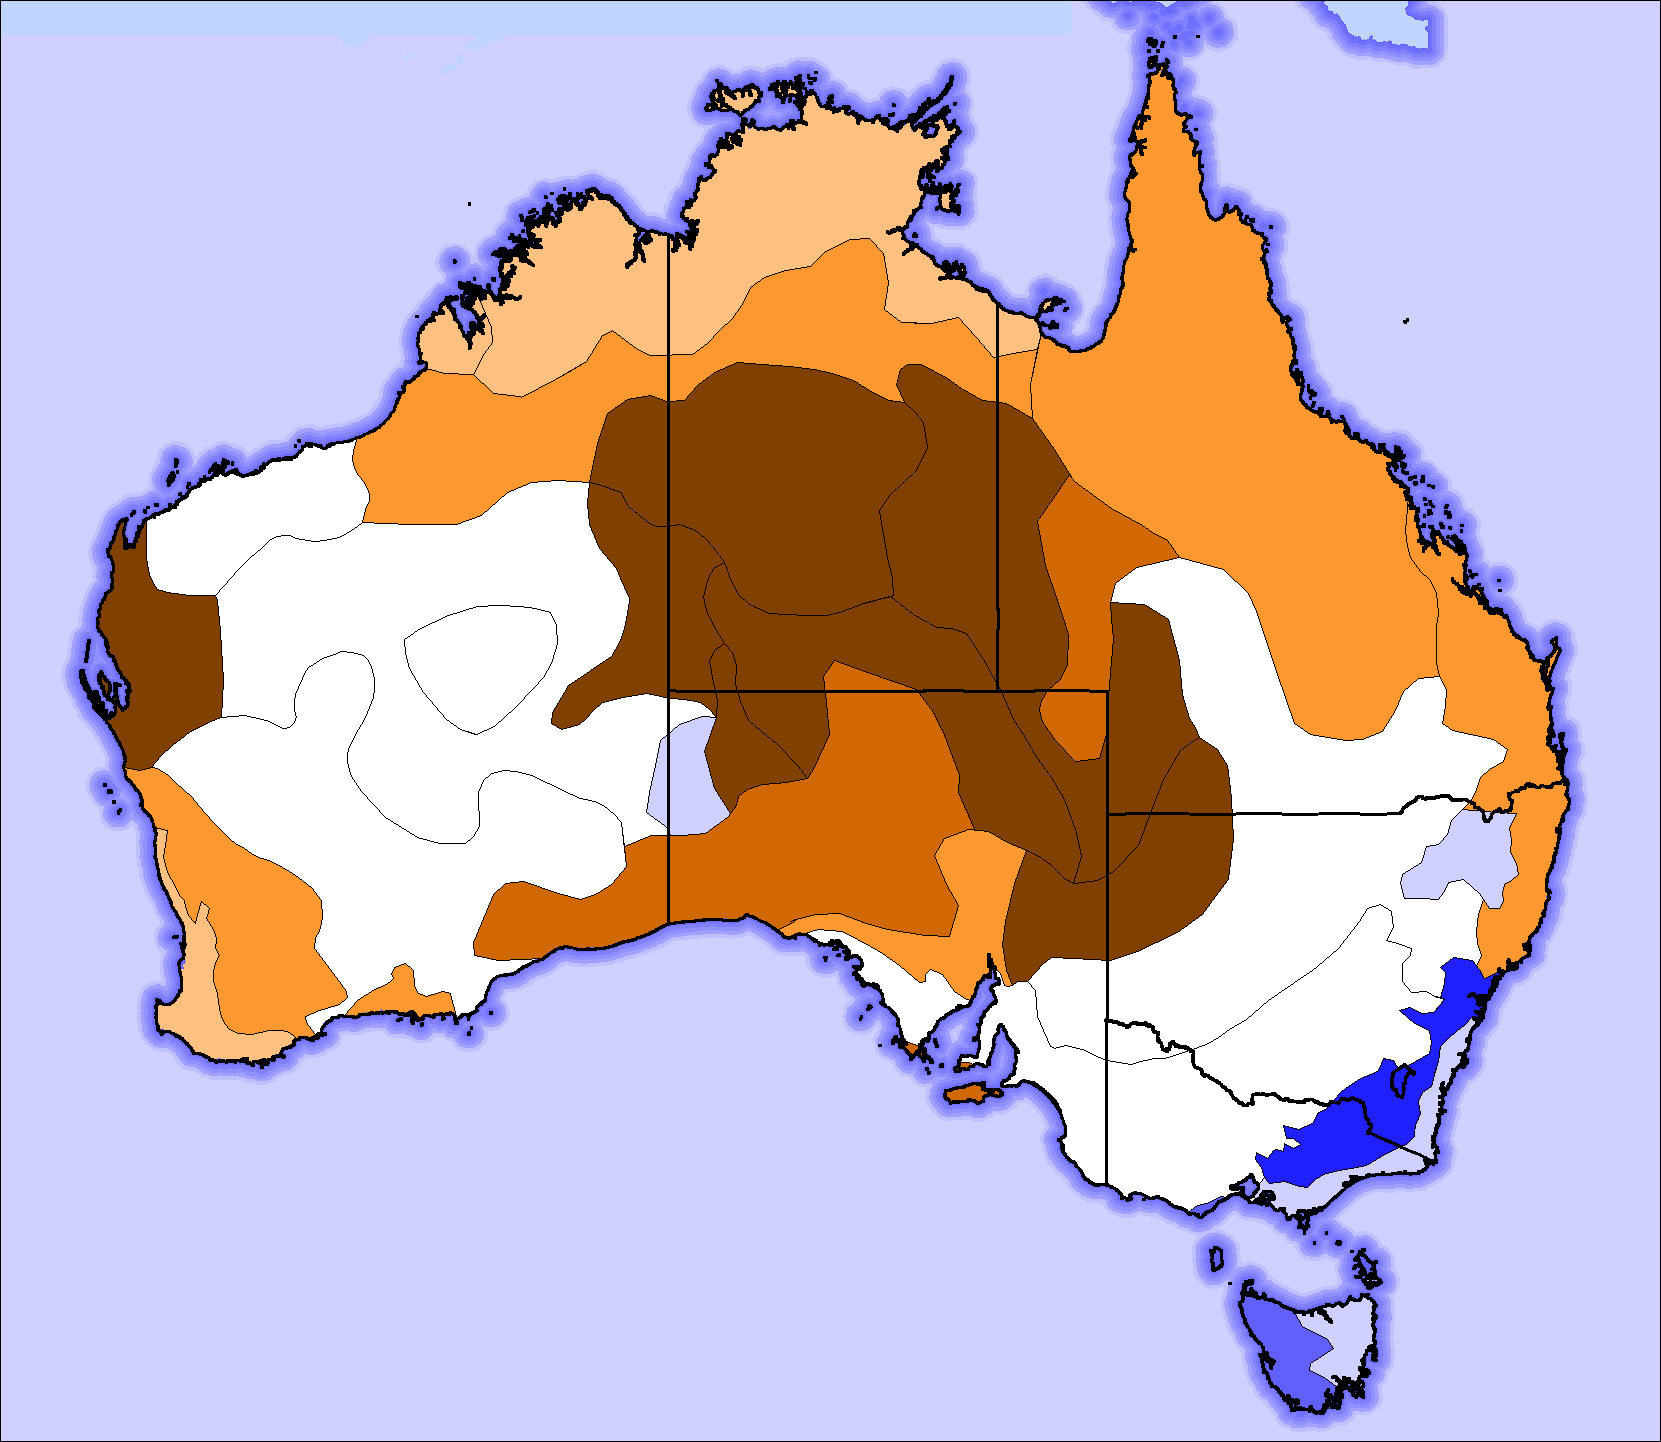
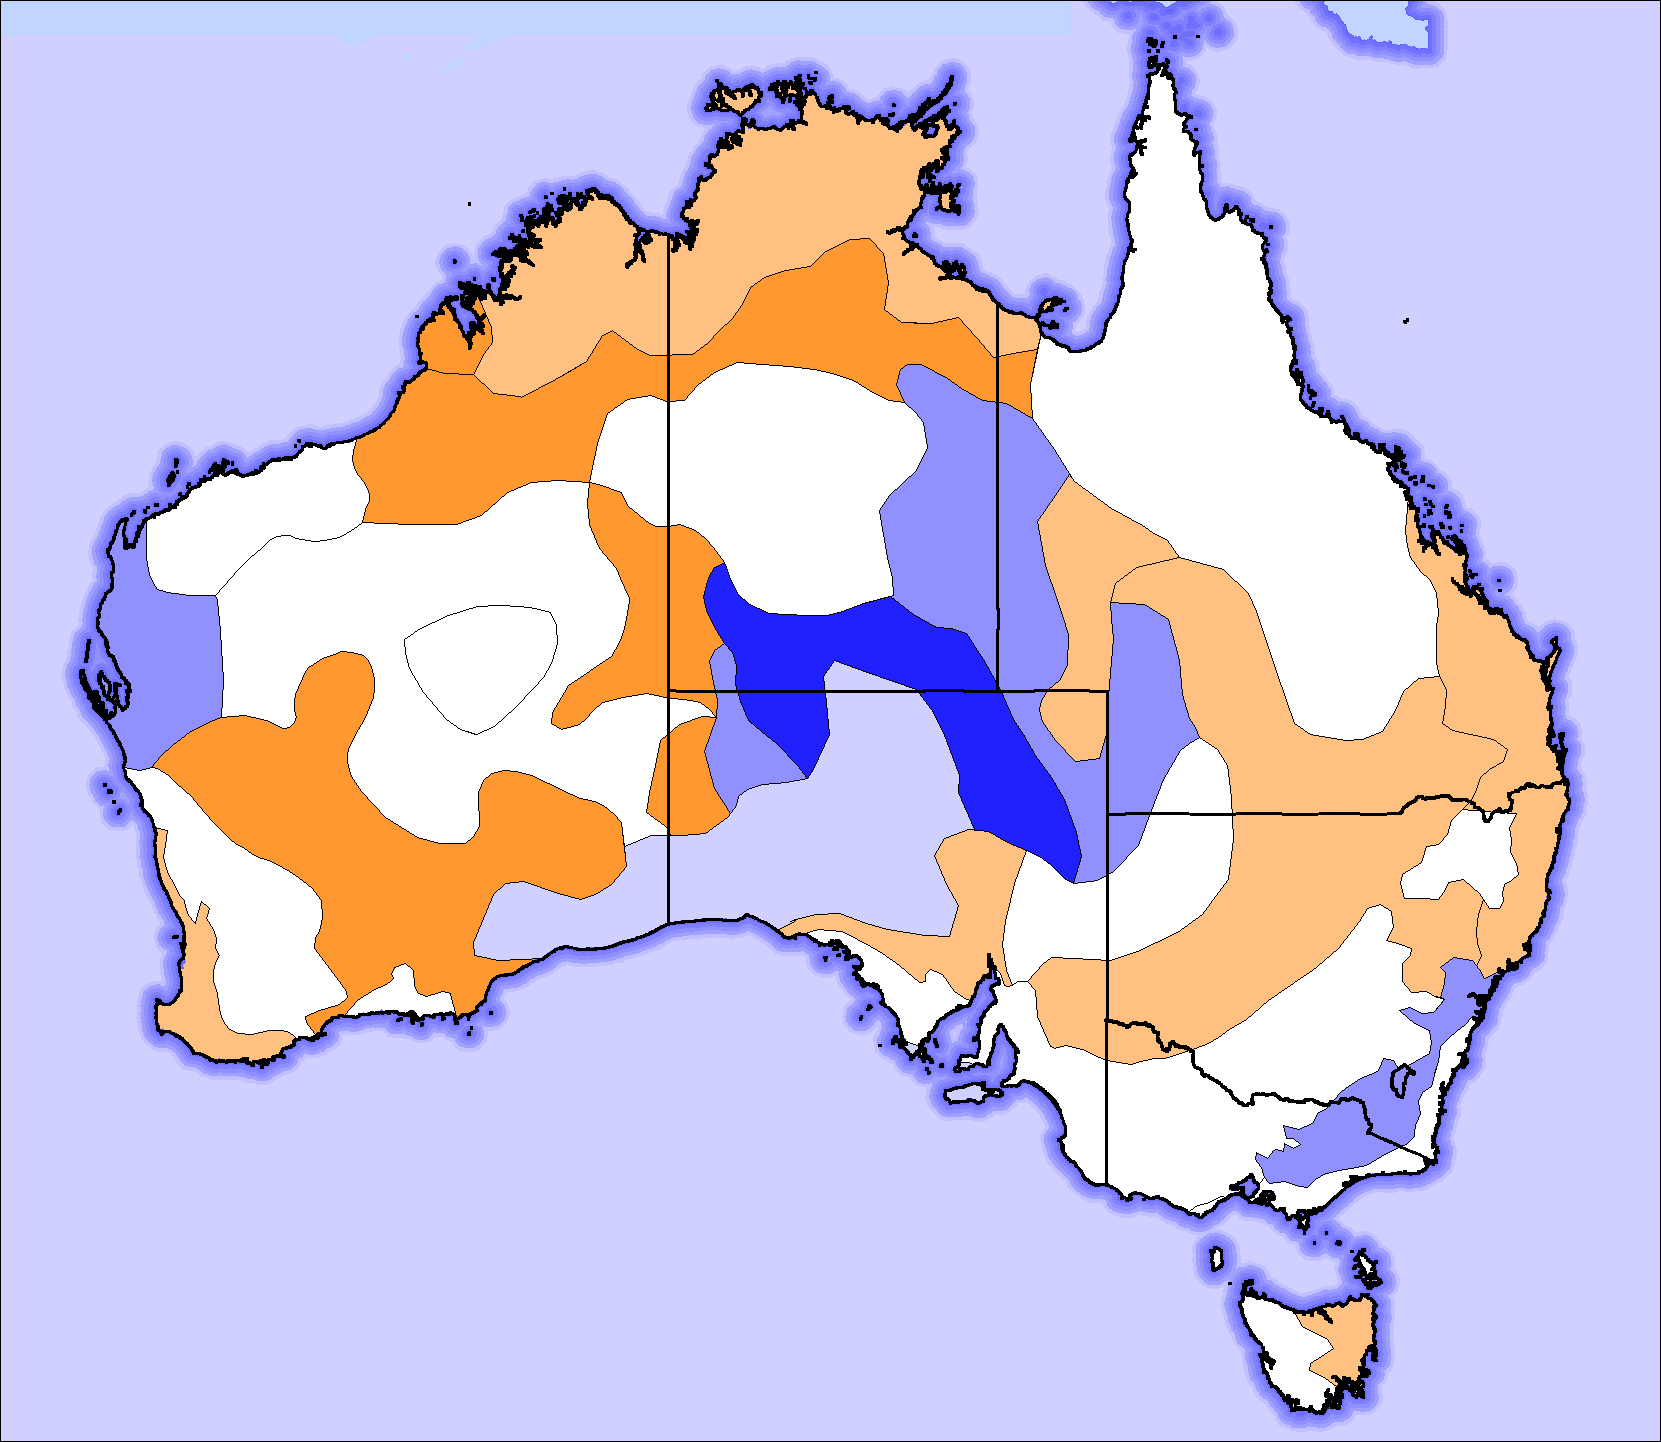
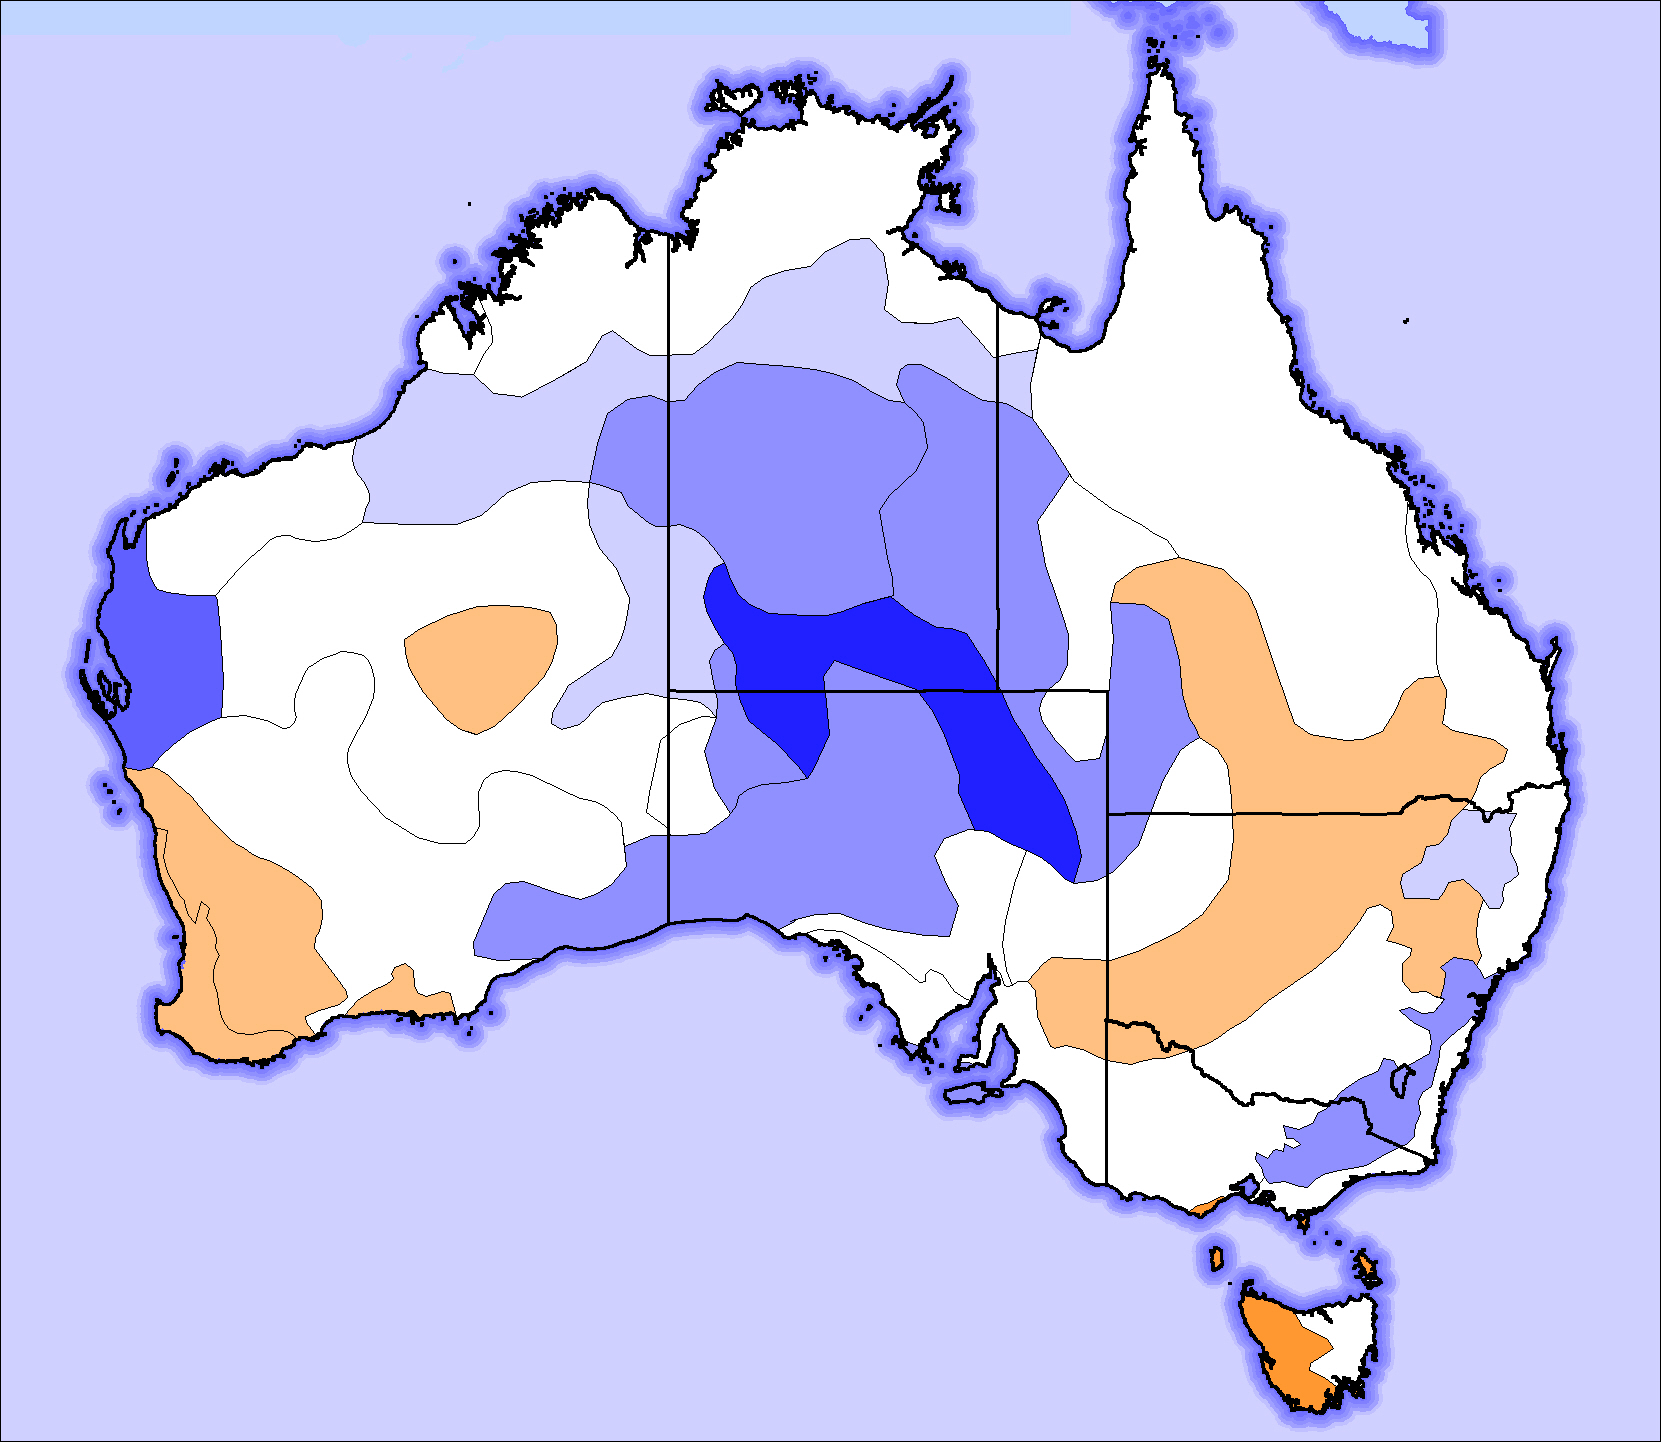
Here is a map of the zones:
References
For detailed background reading see the peer-reviewed paper at
the 2015 MODSIM website
A peer-reviewed paper on the effects of climate change on SE Australian fire seasonality is at
the 2019 MODSIM website
Here is a poster on the earlier work
from the 2015 AFAC Conference in Adelaide. Note the comparison with the "usual" fire season map that has been widely used for decades. [!]
Annual Maps
Click on map to see larger view. Click on the analysis link to see a detailed report.
2019 - 2020: BLACK SUMMER (Analysis)
This is on-going work.
A major change is expected in the next year or two, as the Terra satellite loses its orbital stability. It is widely expected that this will herald a switch to use of VIIRS Sensors instead of MODIS. VIIRS has been launched on both the SUOMI NPP and NOAA20 satellites, and these have provided typically 11 times greater hotspot densities than have MODIS equipped platforms.
Data
We acknowledge the use of data and/or imagery from NASA's Fire Information for Resource Management System (FIRMS) (https://earthdata.nasa.gov/firms), part of NASA's Earth Observing System Data and Information System (EOSDIS).
Papers published by FIRMS on their products:
Giglio, L., Schroeder, W., and Justice, C. O., 2016, The Collection 6 MODIS active fire detection algorithm and fire products. Remote Sensing of Environment, 178:31-41.
Giglio, L., Csiszar, I., Justice, C.O. 2006. Global distribution and seasonality of active fires as observed with the Terra and Aqua MODIS sensors. Journal of Geophysical Research Biogeosciences, 111:G02016, doi:10.1029/2005JG000142.
Giglio, L., Descloitres, J., Justice, C.O., Kaufman, Y. 2003. An enhanced contextual fire detection algorithm for MODIS. Remote Sensing of Environment, 87:273-282.
This web page created 20 Auguat 2022. R. McRae. Contact and feedback: r.mcrae@unsw.edu.au
Updated 11 September 2025.