TERRAIN ANALYSIS EXPLAINED

This page explains the mathatical analyses of terrain data and the maps that arise from them.

SOURCE DATA

The digital elevation model used is from the Shuttle Radar Topography Mission. The space shuttle was flown with a special radar installed. After a large number of orbits there was enough data to build an elevation model of the world (except polar areas).
It took a number of years for the data to be processed, with strong input from the German space agency DLR. In the version 1 data there were some holes and anomalies.
The radar system recorded the backscattered echo of the emitted signal. Most ground surface types returned a sufficient signal for the data to be useful. However The version 1 data was used in the previous contents of this website, but the holes caused some artefacts in the maps. The version 2 dataset has had the holes patched. We thank Geoscience Australia for the work done, as it has made the data far more reliable for fire management.

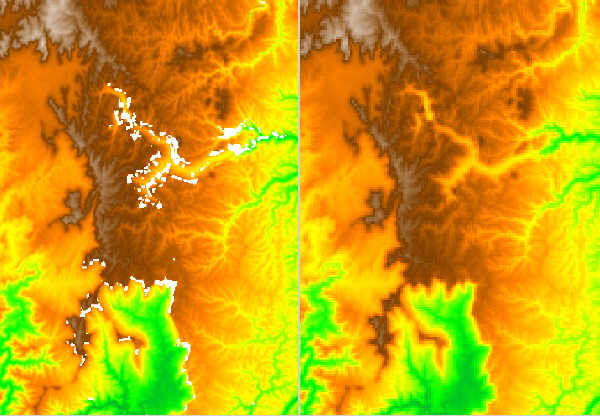
Figure. A comparison of SRTM version 1 and version data around Katoomba in the Blue Mountains of New South Wales. The white areas in the left-hand panel are the data holes, associated with steep clifflines.

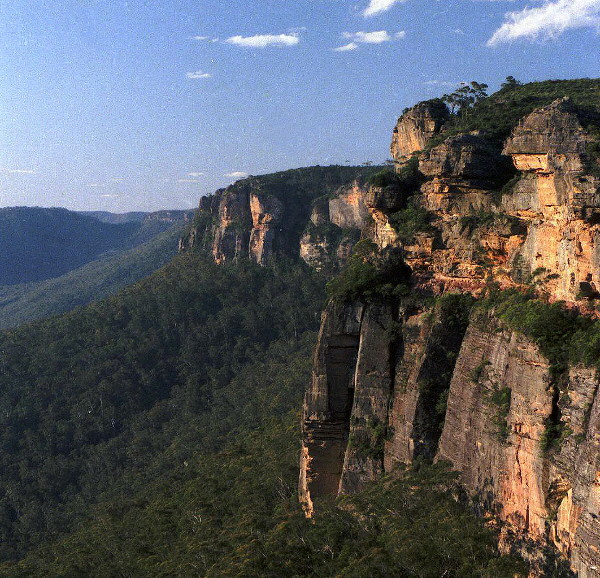
Figure. An example of the terrain not seen by the shuttle mission. Narrow Neck, Katoomba. Photo: McRae

The version 1 data was made available at c.90m resolution, while the version2 was available at c.30m resolution. The raw data were in degrees on the WGS84 spheroid, at 9" and 3" resolution, respectively. For terrain analysis, cartesian distance is important, so the data were reprojected to 90m and 30m. Given the focus on the southeast of Australia, all of the data were projected into GDA94, zone 55. While sone of the areas in the northeast were in zone 56, the errors introduced were acceptable.
All SRTM data are made available by NASA in one-degree by one-degree tiles. These were combined to allow the mathematical analyses described below. The various reprojection and resizing steps can introduce mismatches between the tiles, which manifest as erratic strips of data holes following the degree lines, but on an angle due to the switch into GDA94. Great care has been taken to remove all of these, but a few may have persisted. Users are avdised to be watchful for these in your local area, should any have evaded quality control.

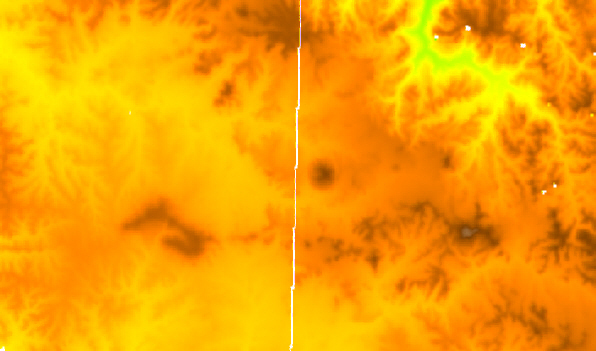
Figure. An example of the tile mismatch artefact, version 1 data.

Go to next page