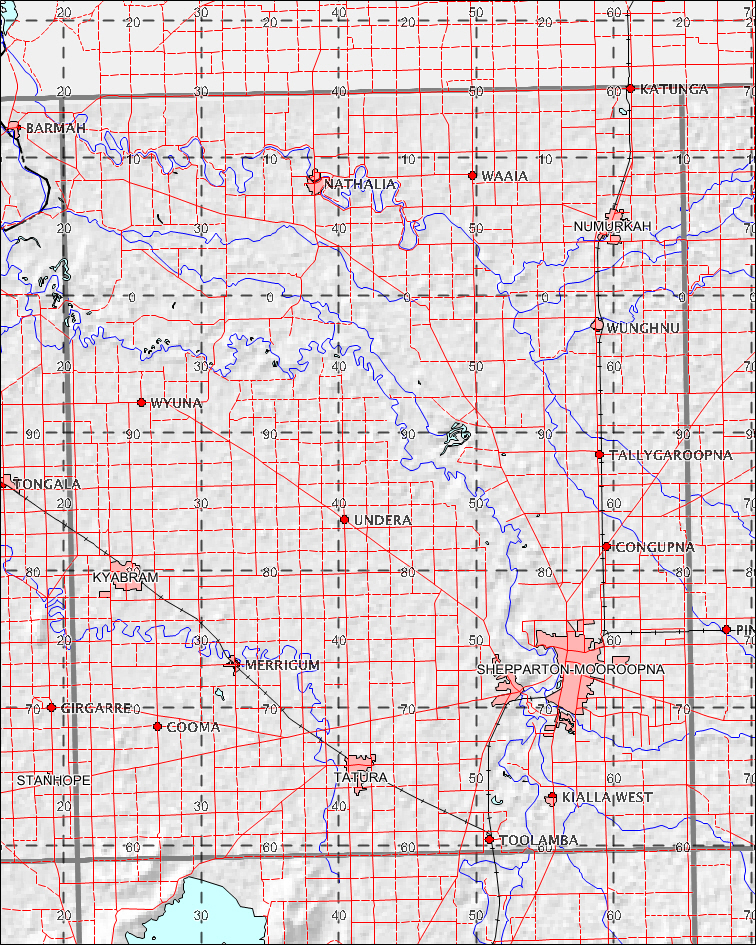
This map depicts, in dark green, parts of the landscape that are intrinsically prone to lightning ignition. Actual ignitions also require a storm to generate lightning that strikes fuel that is dry enough to support a fire. Note that often this is large, elevated fuel, not the fine fuel covered by normal Fuel Moisture Content estimates.
The work is an implementation of: McRae, R. (1992). Prediction of Areas Prone to Lightning Igniton, International Journal of Wildland Fire 2(3): 123-130. As the model is tuned to the southeast, it requires validation in this landscape. Feedback is welcomed.
This map is based on a standard 1:100,000 scale map tile (ref: GeoScience Australia), outlines in grey. Grid north is to the top of the page. Note your local variations for true and magnetic north before using those.
The limited annotation data are from GA's 1:1,000,000 scale products.
This map shows a 10km map grid, on the relevant MGA94 Zone. All elevation data uses SRTM v2 data.
To save the map, wrong-click on it and select 'Save picture as...' or the equivalent option, depending on your browser.